 |
CCP4 Molecular Graphics Documentation |
 |
| Coordinate Model Interface |
Loading model data
Coordinate data can be loaded from PDB or mmCIF files or it can be automatically downloaded from one of the deposition sites. As the data is loaded atom typing and secondary structure analysis are performed. You can choose the appearance of the model using the Picture Wizard tool at the top of the file selection window. The loaded model is shown in the Display Table with the interface described below.
Picture Wizard
The coordinate file browser has options at the top of the window to select a representation style from a menu listing all of the Picture Wizard styles. For most representation styles several display objects will be created as the model is loaded; some of these (for example an object displaying solvent) may be not visible. By default all of the model will be drawn in the selected style but if the Open picture wizard choices option is set on then another window appears with options to select chains, monomers etc. For a few styles the Picture Wizard selection window will always appear (for example for defining an interface) and then selections must be entered.
 Model icon menu functionality
- Visible
- Hide all display objects for this data object or show all the display objects that are not themselves hidden. Note that you can quickly toggle hide/show by clicking on the dot with the right mouse button.
- Centre on
- Put the currently displayed atoms in the centre of the screen and fill the screen with them.
- Picture Wizard
- Access to the Picture Wizard interface.
- Copy picture style from
- Shows a window to select any other loaded model. The display objects in that model will be reproduced in this model. Beware that atom selections (such as specific ligands) which are not the same in both models are liable to lead to no atoms being selected.
- Add model display object
- Add a display object that can represent a selected set of atoms in any colour scheme and a variety of display styles (e.g. spheres, ribbons).
- Add display object
- Add a display object to represent Surface, Hydrogen bonds, Close contacts, Annotation (text labels on the model).
- File Save/Restore ->Save data to file
- Saves the current coordinates to a PDB or mmCIF file - you are prompted for the file name. Any changes such as addition or deletion of atoms or structure transformation will be reflected in the saved file.
- File Save/Restore ->Restore data from file
- Reread the original data file - this effectively undoes any edit or transformation applied to the data.
- List data
- List the atoms in either PDB or mmCIF format (set in the Preferences, General listing/analysis in the Model analysis folder). The coordinate data is prefaces by the file header information from the original data file and any editing or model transformation is reflected in the listing. The listing is in a window which has options to Save option on the File pull-down menu.
- Structure definition - Show load warnings
- By default less serious warning messages from data loading are not shown. This option will show the load warning - see atom typing for more background.
- Structure definition - List secondary structure
- A new window is opened with a listing of the secondary structure assignment for the model. There is an option to save the data to a file.
- Structure definition - Edit secondary structure
- You may specify the secondary structure type for one residue or a range of residues to override the calculated secondary structure. Note:
This information is saved to the .ccp4mg file and will be reinstated on reloaded the same data file.
Note that if you just want to customise colouring by secondary structure that can be achieved by using the Edit colour scheme.. option from the colour menu (see tutorial).
- Structure definition - Load DSSP secondary str.
- Load the secondary structure assignment output by the DSSP program (http://swift.cmbi.ru.nl/gv/dssp/). The DSSP filename will be remembered and loaded automatically if the program is closed and restarted. While DSSP data is loaded there is an option to unload it.
- Structure definition - Edit residue type assignment
- The information in the monomer library is used to categorise residue types (e.g. ALA is 'peptide', H2O is 'solvent') that is used in atom selection. This interface allows overriding the typing and providing a synonym if a monomer in your data has a different name to the definition in the monomer library.
- Structure definition - Edit bonds
- The displayed bonds are usually derived from the monomer library and distance criteria - this interface will override the assigned bonds and the information is saved to the .ccp4mg file and will be reinstated on reloading the same data file. The interface is a table with the option to Add/Delete and then select two atoms. Note:
You can paste an atom name into the interface by left-mouse clicking on a displayed atom and them using the (right-mouse click) context menu in the atom name text widget to Paste the atom name.
Note that you could represent unusual bonds (e.g. metal coordination) using vectors.
- Structure definition - Add inter-residue links
- The bonds between residues are determined from link data in the monomer library and distance criteria but your structure may contain inter-residue bonds that are not defined. This interface will add new links and the information is saved to the .ccp4mg file and will be reinstated on reloading the same data file. The interface is a table which requires you to enter the residue name (usually a three-letter code) and an atom name for both atoms in the link.
- Structure definition - List charge
- List the currently assigned charges for electrostatic calculations.
- Transform coordinates
- See here.
- Generate symmetry mates
- See here.
- Animation
- See here
- Clone
- Load the same coordinate data file again.
- Delete
- Delete the data object. Note that even if you have edited the structure you will not be prompted to save it.
 Model Display Object
A new model display object is created by the Add model display object option on the model dot menu. The display object icon menu has options:
- Visible
- Hide or show the display object. If the object is hidden the icon is greyed. Toggle hide/show by clicking on the icon with the right mouse button.
- Centre on
- Put the display object in the centre of the screen and fill the screen with it.
- Flash
- Make the object flash.
- Set transparency
- Make the object transparent.
- Atom labels
- There are sub-menu options to label no atoms, all atoms, or one atom per one, five or ten residues or SSE or chain termini. If the One atom per res option is on then only one atom in the customised selection of residues is labelled. The labelled atom is either a CA or the first atom in the residue. The Details.. option opens a window to select the components of the label. The defaults can be set in the Preferences Atom label style in the Model display folder.
- Custom drawing style
- By default the drawing parameters such as helix width or sphere radius are controlled by the Preferences Drawing style in the Model display folder. This opens a window with drawing style options to be customised for this display object only. See Drawing Styles for examples of different styles.
- List selected atoms
- List the atoms selected in the display object in PDB or mmCIF format (as chosen in the Preferences General listing/analysis in the Model analysis folder. From the listing window the data can be saved to file.
- Clone
- Create a new model display object with the same selection, colour and style as the current display object.
- Delete
- Delete this display object
Model Display Object Selection Menu
Clicking on the button in the Atom selection column gives the Atom Selection menu.
Model Display Object Colour Menu
Clicking on the button in the Colour scheme column gives the atom colouring menu.
- Atom type
- Colour according to the atom element type. The colour scheme is defined in Preferences Atom type in the Model colours folder.
- By chain
- Colour each peptide or nucleic acid chain a different colour. Solvent, monomers etc. are coloured grey.
- By model
- Colour each NMR/symmetry model a different colour.
- Main/side chain
- Protein main chain and side chain are coloured differently. Non-protein is coloured grey.
- Secondary structure
- The types of secondary structure are coloured differently. The colour scheme is defined in Preferences Secondary structure in the Model colours folder.
- Blend thru model..
- This opens a window with options to customise the colouring but just hitting the Apply button with give the default blend thru model colouring. The colouring is per residue or per seconcondary structure element with the option for turns (not helix or strand) a contast colour.
The interface then consists of a table to select chains (or ranges of residues) and colours for the start and end of the chain (or range). Blending from start to end colour can go clockwise or anticlockwise around the colour wheel.
- Residue property - Residue type
- Colours protein and nucleic acid residues according to their type. The colour scheme is defined in Preferences Residue type in the Model colours folder.
- Residue property - Solvent accessibility
- >Colours according to the sum of the solvent accessibility over all non-hydrogen atoms in the residue. While this colour scheme is applied there is an option on the display icon menu to List colour data. The colour scheme is defined in Preferences Residue solvent accessibility in the Model colours folder.
- Atom property..
- There is a submenu with options Temperature factor, Occupancy,Alternate location, Charge and Solvent Accessibility and Buried area. The colour scheme for each of these is defined in Preferences in the Model colours folder. Note that atoms can also be labelled with temperature factor, occupancy and change.
- Interface to..
- This opens a window with options to colour per atom or per residue and an atom selection widget. Select a set of atoms which can be in this or another model but must NOT be in this display object. The surface area buried by contact with this set of atoms will be calculated and displayed using the colouring scheme defined in Preferences Residue buried area in the Model colours folder. While this colour scheme is applied there is an option on the display icon menu to List colour data.
- Edit colour scheme..
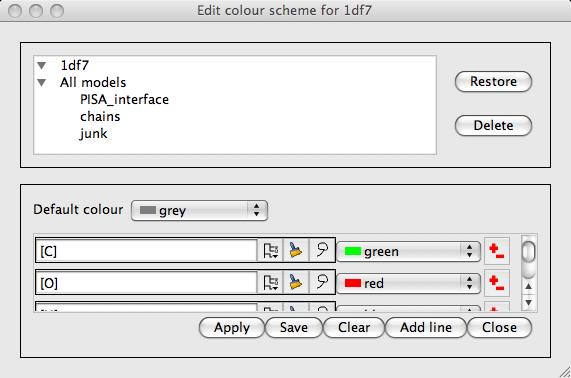 The rules for the current colour scheme are presented in a new window. If the current colour scheme is one of the colour by atom or residue property options or blend thru model then the rules can not be edited. The window (shown left) specifies a default colour and then a list of rules which are a selection criteria and a colour. The selection criteria button accesses the usual selection menu to change the selection. The colour menu has a Colour browser option which accesses the full colour browser window with a option to create new colours. Note that the order of the rules is significant as later rules override previous ones. The Save button will save the edited colour scheme. Note that the scheme can be saved so that it is accessible for only the current model or for all models. The information is saved to the model definition file.
- Non-carbon by atom type
- If this option is checked on then carbon atoms will be coloured by the scheme selected from the rest of the interface and the non-carbon atoms will be coloured by their atom type.
- Colour browser..
- A sub-menu lists possible colours and has a option New colour to open the interface to define a new colour to add to the list of options.
- Stick colour
- Choose the colour of the stick in ball-and-stick representation. The default is the Same as atom.
Colouring by Atom/Residue Property
The Colour Scheme menu has options for Atom properties and Residue properties including Temperature factor, Occupancy, Charge and Solvent Accessibility. There is a Colour legend option on the display object icon menu (the dot next to the model name) which displays a legend. The colour coding can be changed in the Preferences window, look in the Model colours folder. In this colour preferences window the defined parameters are
| Below/Above normal range colour |
Colour for atoms with data values below or above the defined ranges |
| Data value |
The lower range value |
| Colour |
Colour for atoms with the data value Range value |
| Add range/colour button |
Add an extra line to the table. |
| Right mouse click on line in table |
Options to Delete range/colour or Insert above |
| Interpolate |
Three modes for colouring (see below) |
| direction (only for around colour wheel interpolation) |
direction round the colour wheel |
 The colour wheel is shown left. By default colour interpolation is applied in around colour wheel mode. This means that an atom/residue with a data value between two of the range values in the table will be given a colour which is a mixture of the two appropriate colours with the path from one colour to the other following an arc around the colour wheel. The alternative interpolation mode is between RGB values which takes a straight line path across the colour wheel. This latter mode looks better for colour schemes include a white middle state e.g. red-white-blue.
If colour interpolation is switched off then all atoms/residues with data values between one range value and the next highest range value are given the same colour. In this mode the colour for Above normal range is not used - all atoms/residues with data values above the highest range value are given the colour for that range.
Model Display Object Style Menu
It is quicker to try the options than to read about them - so do that!
The final option Join display objects is on by default and means that when a model is split into more than one display object, such as a main chain ribbon and side chain cylinders, the bonds connecting the two objects will be drawn.
Temperature Factor Spheroids
The temperature factor spheroid icon menu includes the options:
- Scale
- Enter a number to scale the size of the spheroids.
The selection menu lists the model display objects; when one of these is selected temperature factor spheroids will be drawn over all of the atoms in that object.
The display style menu has options to draw the spheroids as Axes, Solid or Solid&Axes. The quality of the rendering in Solid mode is controlled by the Preference Render quality in the Display folder.