Contents
IntroductionGeometry
Hydrogen Bonds
Displaying vectors
Solvent Accessibility Surface
 |
CCP4 Molecular Graphics Tutorials | |
| Investigating a Structure |
| Documentation Contents | On-line Documentation | Tutorials | CCP4mg Home |
Load any molecule of interest to you or use any one from the tutorial. It is easiest to work if the Display style is Bonds or Fat bonds.If you want to look at two or more homologous structures then the structures can be superposed.
This section introduces some basic tools for interrogating the structure. From the Application menu select Geometry.
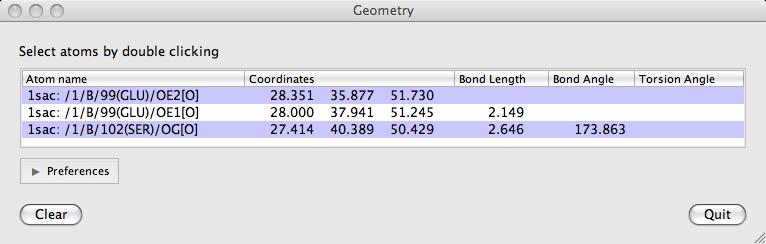
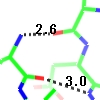
Double-click on atoms with the left mouse button to see them listed in the Geometry window. The window lists: the distance between an atom and the previously clicked atom; the bond angle between an atom and the two preceeding atoms and the torsion angle defined by the atom and the three preceeding atoms. Shift+double-click will start a new "tree" of selections. i.e. the atom's distance to the previous one will not be shown.
The Clear button will clear the list and the displayed lengths.
![]() To display the hydrogen bonds within the loaded model click on the model icon and select the Add display object.. .. Hydrogen bonds. Note also the Close contacts option on the same menu that has a very similar interface to the hydrogen bond interface that we are about to look at. Now all hydrogen bonds within the structure are displayed and, in the display table, an extra line appears under the model name.
To display the hydrogen bonds within the loaded model click on the model icon and select the Add display object.. .. Hydrogen bonds. Note also the Close contacts option on the same menu that has a very similar interface to the hydrogen bond interface that we are about to look at. Now all hydrogen bonds within the structure are displayed and, in the display table, an extra line appears under the model name.
 From the Hbonds icon menu select Drawing style and in the new window check the box labelled Label with distance/bond length. From the Hbonds icon menu you can also select List HBonds and the CCP4mg file viewer will open listing all of the hydrogen bonds in one tab. It is possible to save such listings to a file via the Save option on the file viewers File drop-down menu.
Several tools show listing in the file viewer: close contacts, secondary structure and the solvent accessibility.
It is possible to display only the hydrogen bonds between two specified sets of atoms. The two sets of atoms are controlled by the menus in the first two columns of the table. By default the first atom selection is All atoms; click on this and change it to Main chain (in a sub-menu from Peptide). The second set of atoms remains Same as other so only HBonds between main chain atoms and main chain atoms are shown. Now try changing the Same as other to Side chains to see all HBonds between main chain and side chain atoms.
The criteria for HBonds can be changed in the Preferences window (on the Edit pull-down menu) - look in the Model analysis folder for Hydrogen bonds.
If you want to include hydrogen bonds when creating an image you may want to have more options on display style or to be able to add or delete some bonds. These things are possible if you export the hydrogen bonds as vectors.
Generate a vector file
by clicking on the Hbond display object icon and selecting Export vectors.
In the file selection window enter the name for a vector file and make sure that the Read exported vector file into CCP4mg checkbox (at the top of the window) is checked on. When you click the Save button the display window should not change significantly but a new vector object should be listed in the display window. The HBonds have been written to a file and then that file has been loaded and displayed in a similar style to the original data. To avoid confusion with the original data either delete or hide the original HBonds.
 Now look at the new vector object in the display table and click on the right button (the button is probably labelled 'complement dashed') to open a window controlling the display style of the vectors. For example style dashed cylinder works well if your model is displayed as cylinders or ball and stick. You may want to change the cylinder radius and dash length.
Also try changing options in the Labels section.
 From the Vector data icon menu select Edit vectors to open a window with tools to edit the vector.
At the top of the new window is a list of the current vectors representing hydrogen bonds. Clicking on an item in this list will load that vector into the edit tools in the rest of the window. The tools show the selection for the start and end atom and the annotation that appears by the vector. This interface can be used to add or delete 'hydrogen bond' vector.
From the Vector data icon menu select Edit vectors to open a window with tools to edit the vector.
At the top of the new window is a list of the current vectors representing hydrogen bonds. Clicking on an item in this list will load that vector into the edit tools in the rest of the window. The tools show the selection for the start and end atom and the annotation that appears by the vector. This interface can be used to add or delete 'hydrogen bond' vector.
After changing the vectors it is possible to save the changes to the vector file. (Note that, unlike say model coordinate files and map files the vector file contains information on how you would like the data to be displayed). To see the format of a vector file.
From the Vector data icon menu select List data to open a file viewer listing the vectors and their appearance.
The solvent accessible surface area is the surface area that is accessible to a 'water molecule'. In calculations the 'water molecule' is usually represented by a sphere of about 1.4Å radius. To colour a model by the SAS area: from the Colour scheme menu select Residue property and then Residue solvent access. There may be a short pause for the calculation and then the model is coloured with mostly blue on the inside of the model and red residues on the outside of the model.
When the display object is coloured by some interesting chemical property the display object icon menu ![]() has an item List colour data. This will open the file viewer listing the solvent accessibility of residues and atoms.
has an item List colour data. This will open the file viewer listing the solvent accessibility of residues and atoms.
The parameters for the SAS calculation are accessible in the Preferences window (on the Edit menu) in the Model analysis folder Solvent accessible surface. There is little reason to change these but you may want to change the colour coding. To do this open the Model colours folder in the Preferences window and select Residue solvent access.
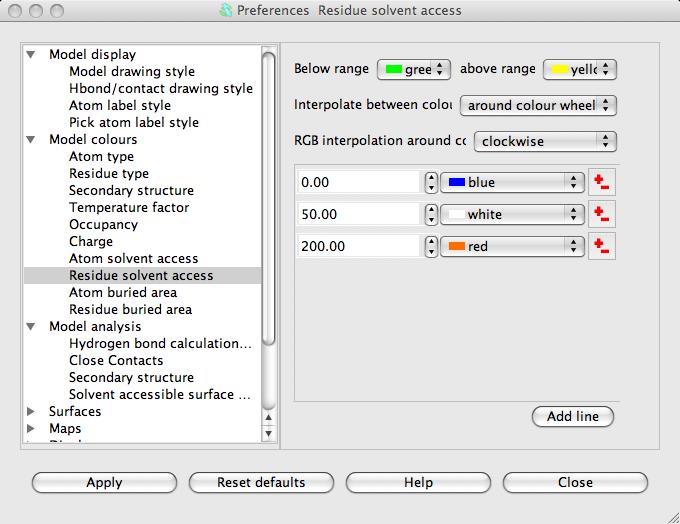
The window has a table showing the parameter value and the colour for that parameter value. Every residue on the display is given a colour, dependent on its SAS, which is interpolated from the fixed values and colours in the table. If a residue SAS falls outside the normal range of values in the table then it is given one of the colours, specified at the top of the window, for below or above the normal range. The 'outside normal range' colours are usually contrasting the normal colours in order to draw attention to outliers but they could be made the same as the normal range colours. Note that any solvent in your model is coloured green (or the below normal range colour) because it is usually excluded from the SAS calculation and assigned a value of -1.0.
Note that there is also an option to colour by atom SAS: from the Colour scheme menu select Atom property and then Atom solvent access.