Contents
Starting CCP4mgCopying some data to your own area
Loading a PDB/mmCIF file
Changing the view
Finding things in the molecule
The Display Table
Creating a model display object
Creating hydrogen bonds
 |
CCP4 Molecular Graphics Tutorials | |
| Introduction - loading and viewing a PDB/mmCIF file |
| Documentation Contents | On-line Documentation | Tutorials | CCP4mg Home |
This may depend on your installation but normally:
Windows: double click on the CCP4MG icon in the desktop, or click on
Start->All Programs->CCP4 Molecular Graphics->CCP4MG
Linux: type ccp4mg in a terminal window.
Macs: double click on the QtMG icon in the Applications folder
A window with two panes should appear: the large 'main window' and the small 'Display Table'.
Some data files are provided which you should copy to your own area.
Or you can try using your own PDB or mmCIF files and MTZ or CCP4 map files.
From the File pull-down menu select Get tutorial data. You will be told that a directory called ccp4mg_tutorial has been created in your home area.
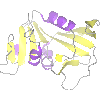
From the file pull-down select Open data file. At the top of the Open data file window there is a picture wizard menu which allows you to select the appearance for a newly loaded model and next to the menu is a small picture showing an example of a model drawn in the current style. Try looking at some of the styles available in the menu but initially select, from the ribbons folder, colour blend thru chain. Now select a file: go to the ccp4mg_tutorial directory in your home area and select 1df7.pdb or a coordinate file of your choice (preferably one containing ligands). Click on the Open button and then close the file selection window.
Another method is to download coordinates from one of the online PDB archives. From the File menu select Download coordinate file and in the download window enter the 4-letter code for a model (e.g 1alz). If you click return in the code window then a default name for the local PDB file is shown in the line below. Click the Apply button and the file will be downloaded to your computer and read into CCP4MG. If you do not know the 4-letter code for the structure that you want then click on the View server web page button to bring up a web browser showing the structure database query page. Once you have found the structure you want you can use either the database download option or the CCP4 interface.
Addtionally, you can click on model files in the CCP4mg documentataion browser window to load them into the program.
If this is the first model that you have loaded it should be in the centre of the screen but if it is not go to the View menu and select Recentre.
Rotate: with the cursor in the main window, hold down the
left mouse button and drag left-right or up-down.
Rotate about out-of-screen axis hold down the shift key and the left mouse button and move mouse in circular motion.
Zoom: Use the mouse wheel or hold down the middle mouse button and drag up-down. Zoom can also be set
by hand by doing Display->show/change zoom. This useful in getting the same zoom factor for different images.
Translation: hold down the shift key and middle mouse button and drag.
On a Mac laptop with a trackpad, Ctrl+trackpad "button" does the same as right mouse button, Alt+trackpad "button"
does the same as middle mouse button.
Centre on an atom: double click on the atom or right-click on the atom and select "Centre on ..."
Clip planes help you see an area of interest by
removing everything in front or behind the centre of the display.
Clip planes can be switched on or off in the Display menu.
Clip plane width: Hold down the c key and the
middle mouse button and move mouse up or down.
![]() Fog helps you to see depth by making distant parts of the structure
fainter.
Fog can be switched on or off in the Display menu.
Fog helps you to see depth by making distant parts of the structure
fainter.
Fog can be switched on or off in the Display menu.
![]() This tool will move the view so an atom or residue of your choice
is at the centre of the screen. From the View pull-down menu select Find/centre on...
This tool will move the view so an atom or residue of your choice
is at the centre of the screen. From the View pull-down menu select Find/centre on...
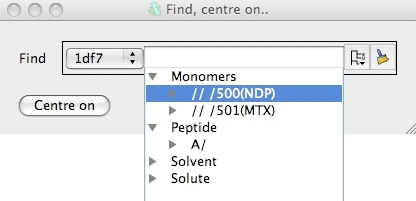
In the new window you can select a chain or residue(s) or atom(s) and
click the Centre on button to go to the selection.
![]() Click on the tree view to open the tree view of the model. The tree view works like a
file browser with the model split at the first level into peptide, monomers and
solvent etc.. Open the monomers folder and select one of the ligands by
clicking on it. Click on the Centre on button to go to the
selected ligand. The view will change to show the selected ligand.
Click on the tree view to open the tree view of the model. The tree view works like a
file browser with the model split at the first level into peptide, monomers and
solvent etc.. Open the monomers folder and select one of the ligands by
clicking on it. Click on the Centre on button to go to the
selected ligand. The view will change to show the selected ligand.
The tree view selection tool is used in many parts of the program. You can click on more than one line in tree view. The selected atoms and residues are reported in the line edit widget above the tree view. The syntax used for the atom and residue names (e.g. A/27/CA) is loosely based on Linux computer file system names with the different levels in the model hierarchy of chain, residue and atom separated by a forward slash. The residue type might also be included in the residue level (e.g. A/27(ASP)/CA). You can also type a selection command into the line edit widget.
![]() To clear the selection click on the clear icon. The tree view can be closed by clicking elsewhere in
the window or hitting the Esc button.
To clear the selection click on the clear icon. The tree view can be closed by clicking elsewhere in
the window or hitting the Esc button.
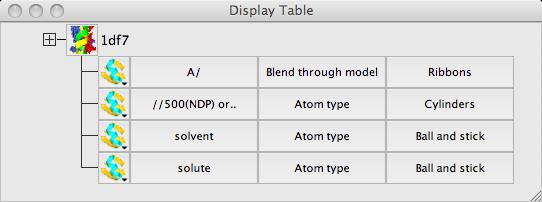
The display table lists all of the loaded data objects (for example each loaded PDB, mmCIF, MTZ or map file becomes one data object). For each data object the display objects are listed one per line. You probably have one (1df7) data object and several display object currently listed.
![]() Usually the easiest way to set up a picture is with the Picture
Wizard which you saw when opening the PDB file. It can also be used to
change the display of a PDB file that is already loaded.
Click on the icon next to the name of the data object to
open a menu with several options including
Picture wizard.. which opens a window with the picture wizard to
change the appearance of the model. Note the button in this window to
Delete existing display objects which should be checked to
clear the existing picture. You can try some of the options. Note that
some of the picture styles require you to select groups of atoms; for
example interfaces must be between two groups of atoms. Most styles
will make intelligent atom selections automatically.
Usually the easiest way to set up a picture is with the Picture
Wizard which you saw when opening the PDB file. It can also be used to
change the display of a PDB file that is already loaded.
Click on the icon next to the name of the data object to
open a menu with several options including
Picture wizard.. which opens a window with the picture wizard to
change the appearance of the model. Note the button in this window to
Delete existing display objects which should be checked to
clear the existing picture. You can try some of the options. Note that
some of the picture styles require you to select groups of atoms; for
example interfaces must be between two groups of atoms. Most styles
will make intelligent atom selections automatically.
![]() It is possible to edit the the scenes created by the Picture
Wizard or create display objects from new. To see how to do this
go back to the display table. For each display object there is an icon and three buttons for the Atom Selection, the Colour Scheme and
the Display Style of the display object. Click on the icon and you
will see a menu with options to control (among other things) the
object visibility. You can also hide or show an object by
clicking on the icon with the right mouse button. Hide all of the
objects before creating a new one..
It is possible to edit the the scenes created by the Picture
Wizard or create display objects from new. To see how to do this
go back to the display table. For each display object there is an icon and three buttons for the Atom Selection, the Colour Scheme and
the Display Style of the display object. Click on the icon and you
will see a menu with options to control (among other things) the
object visibility. You can also hide or show an object by
clicking on the icon with the right mouse button. Hide all of the
objects before creating a new one..
![]() Create a new display object: click on the model object icon
and select Add model display object from the menu.
Create a new display object: click on the model object icon
and select Add model display object from the menu.
![]() A new
line should appear in the display table which shows that all of
the model is selected and is coloured by Atom type and drawn in display style
Bonds. We will look at these three items in reverse order.
Click on the button labelled Bonds and you will
see a menu with many options for different drawing styles - try
these, beware some options are not appropriate for this model and
nothing will be drawn. Finally select Cylinders before moving
on to click on the button labelled Atom
type to see a menu of alternative colouring schemes, try some such
as Secondary structure and Residue property ->
Residue type.
A new
line should appear in the display table which shows that all of
the model is selected and is coloured by Atom type and drawn in display style
Bonds. We will look at these three items in reverse order.
Click on the button labelled Bonds and you will
see a menu with many options for different drawing styles - try
these, beware some options are not appropriate for this model and
nothing will be drawn. Finally select Cylinders before moving
on to click on the button labelled Atom
type to see a menu of alternative colouring schemes, try some such
as Secondary structure and Residue property ->
Residue type.
To alter the selection of atoms displayed click on the button labelled All atoms. The menu that appears has some quick selection options such as Peptide and CA trace. Try the Selection browser.. option which opens a new window with a tree view of the model similar to that seen in the Find/centre on interface earlier. You can unselect everything with the Clear button at the bottom of the window. Then try opening the Peptide branch and 'digging down' to select ranges of residues and individual atoms in the models. You will need to click the Apply selection button at the bottom of the window to see the display updated. Beware that if you have a higher level selected (e.g. 'peptide') then everything in the branch is selected even if it is not highlighted.
![]() Now try looking at some of the specialised selection tools accessed
from the combobox at the top right of the Selection browser
window. When you choose an tool from this combobox a new frame
appears near the top of the browser window.
Now try looking at some of the specialised selection tools accessed
from the combobox at the top right of the Selection browser
window. When you choose an tool from this combobox a new frame
appears near the top of the browser window.
To select just the residues of the binding site for one of the ligands try the following. Choose the neighbours option from the selection tools combobox. In this tool you must enter some 'central' group of atoms or residues and all the neighbouring structure will be selected. In the new frame there is a selection widget similar to that in the Find/centre on interface. Click on the tree icon and select one of the ligands from the Monomers branch. Then click on the Select neighbours button. You will see the residues around the ligand drawn on the display but, by default, the ligand itself is not drawn. You might like to go back to the display table and make the display object of the ligand visible. You can also go back to the tree view of the model and see that the residues selected by the Neighbours tool are now highlighted. You can use the tree view to change the selection for the binding site.
After editing a complex selection you may like to save it: click the Save button at the bottom of the window and, in the new window, enter a name for the selection before clicking the Save button.The saved selections can be accessed from the saved selection tools tab.
![]() The current display objects are (probably) all
model display objects. There are other types of display object to show
hydrogen bonds, contacts, surfaces and annotation on the model. For
example try creating a hydrogen bond display object. From the model
icon menu choose Add display object and
HBonds. A new row with the HBonds icon appears in the
display table and all the hydrogen bonds in the model will be
drawn. To show only the hydrogen bonds between the ligand and the
binding site you need to change the first two columns in the display
table which are two sets of atoms. First click on the
left hand column in the display table (currently labelled All atoms)
and select Monomers. To select the binding site try restoring
the selection that you saved earlier. Click on the middle row (currently
labelled Same as other and select Selection browser.
From the tools combobox at the top right of the selection browser window
pick saved selection. From the listing of saved selections
pick your saved binding site and click Restore. You now
see hydrogen bonds between the ligand(s) and the binding site.
The current display objects are (probably) all
model display objects. There are other types of display object to show
hydrogen bonds, contacts, surfaces and annotation on the model. For
example try creating a hydrogen bond display object. From the model
icon menu choose Add display object and
HBonds. A new row with the HBonds icon appears in the
display table and all the hydrogen bonds in the model will be
drawn. To show only the hydrogen bonds between the ligand and the
binding site you need to change the first two columns in the display
table which are two sets of atoms. First click on the
left hand column in the display table (currently labelled All atoms)
and select Monomers. To select the binding site try restoring
the selection that you saved earlier. Click on the middle row (currently
labelled Same as other and select Selection browser.
From the tools combobox at the top right of the selection browser window
pick saved selection. From the listing of saved selections
pick your saved binding site and click Restore. You now
see hydrogen bonds between the ligand(s) and the binding site.
To change how the hydrogen bonds are drawn click on the hydrogen bond display object icon and select Drawing style and try the options in the new window.