Improvement of noisy maps by bulk
solvent correction
By A. Fokine & A. Urzhumtsev
Laboratory of Crystallography and Modelling of
Mineral and Biological Materials, UPRESA 7036 CNRS, University Henri Poincaré,
Nancy I, 54506 Vandoeuvre-les-Nancy, France
e-mail :
sacha@lcm3b.u-nancy.fr
Introduction
The main goal of the structural crystallography is to build a model of
the crystal under study. For macromolecules, to do so an electron density map
calculated at a finite resolution, as high as possible, is necessary. A
distribution of the electron density in a crystal can be represented by a
Fourier series with the coefficients Fobs
the main contribution to which comes from ordered atoms, Fatom, and from bulk solvent, Fsolv :
Fobs = Fatom
+ Fsolv . (1)
The
complex values Fobs are
not available from a single X-ray diffraction experiment and usually they are
approximated by
Fobs ~ |Fobs|exp(ijest) (2)
where
jest are some estimations for structure-factor
phases.
However, since the main goal of the
map interpretation is to build an atomic model, it seems that the map
calculated with the coefficients Fatom
should be more suitable for this purpose (Urzhumtsev, 2000) than the
traditional map calculated with the coefficients (2). If we assume that the
bulk solvent contribution to the diffraction pattern can be estimated before an
atomic model is known, these structure factors can be approximated as
Fatom ~ (|Fobs|exp(ijest) - Fsolv). (3)
It
should be noted that the substitution (|Fobs|exp(ijest) - Fsolv) for |Fobs|exp(ijest) changes not only the phases of the Fourier
coefficients but also their moduli, differently from standard phase improvement
methods (taking apart weighting of moduli by figure of merit of corresponding
phase).
The numerical tests discussed below show that such map correction by subtraction of the bulk solvent contribution can significantly improve the quality of density maps. For such study, we simulated the problem arising in the single isomorphous replacement (SIR) method and analysed the quality of SIR maps, calculated before and after bulk solvent contribution, as a function of resolution and error in the position of the heavy atom.
Tests description
Atomic model
The crystal structure of Fab fragment of monoclonal antibody LNKB-2
solved at 2.2 Å resolution (Fokin et al.,
2000) was chosen as a test model. Crystals of Fab-LNKB-2 belong to the space
group P212121 (a = 72.24 Å, b = 72.01 Å, c =
86.99 Å) and contain one molecule per asymmetric unit. Solvent region occupies
42% of the unit cell volume. Fab fragment molecule consists of two polypeptide
chains (with 219 and 220 amino acid residues, respectively). 213 water
molecules are included in the atomic model.
Solvent structure
In order to simulate the contribution of the bulk solvent we used the
approach by Jiang & Brünger (1994). A binary solvent mask (1 in solvent
region 0 in protein region) was calculated by program CNS (Brunger et al., 1998) with the parameters SOLRAD
and SHRINK equal to 1.0 Å. The corresponding structure factors Fmask were exponentially
scaled
Fsolv = ksol exp(-Bsolsin2(q)/l2) Fmask (4)
with
scaling parameters ksol and Bsol chosen as 0.40 e-/
Å3 and 70 Å2 , respectively.
The structure factors Fsolv
of the bulk solvent were then added to structure factors Fatom calculated from the atomic model giving the total
structure factors of the crystal
Ftot = Fatom + Fsolv. (5)
Each set of structure factors included 23673 reflections and
corresponded to the full data set up to 2.2 Å resolution.
Numerical SIR simulation
A SIR-like situation was simulated as it was described previously in
(Urzhumtsev, 1991). An artificial gaussian heavy atom was placed in the cavity
between two variable and two constant domains of Fab molecule. For this
artificial heavy-atom derivative structure factors Fder were calculated as
Fder = Ftot + FH (6)
where
FH are structure factors for the heavy atom. The number of electrons in
the heavy atom was chosen such that its contribution to the structure factors
was
RH = S|FH| / S|Ftot| = 0.1 . (7)
In
the tests, the moduli of structure factors Ftot
and Fder were supposed to
be known and simulated the experimental magnitudes for the native crystal and
its derivative. The position of heavy atom was supposed to be determined either
absolutely accurately or with the coordinate error of 1.0 or 2.0 Å, depending
on the test. The |Ftot|
and |Fder| values and
heavy atom parameters were used to calculate phases jsir and their figures of merit msir
with the standard SIR technique (Blow & Rossman, 1961).
Electron density maps
SIR-phased Fourier syntheses
rsir(r)
= V-1{Sh msir|Ftot(h)|exp(ijsir(h))
exp(-2pihr)} (8)
and
the syntheses with subtracted bulk solvent contribution
rcorr(r) = V-1{Sh [ msir|Ftot(h)|exp(ijsir(h))
- Fsolv ] exp(-2pihr)} (9)
were
calculated using reflections with the resolution d > dmin,
where dmin was equal to
2.2, 3.0, and 6.0 Å depending on the test (here V is the unit cell volume). For
comparison we calculated also the maps with the coefficients Fatom
ratom(r) = V-1[Sh Fatom(h)exp(-2pihr)]. (10)
All
syntheses were normalised with respect to their mean value and standard
deviation s.
Numerical comparison of electron density maps
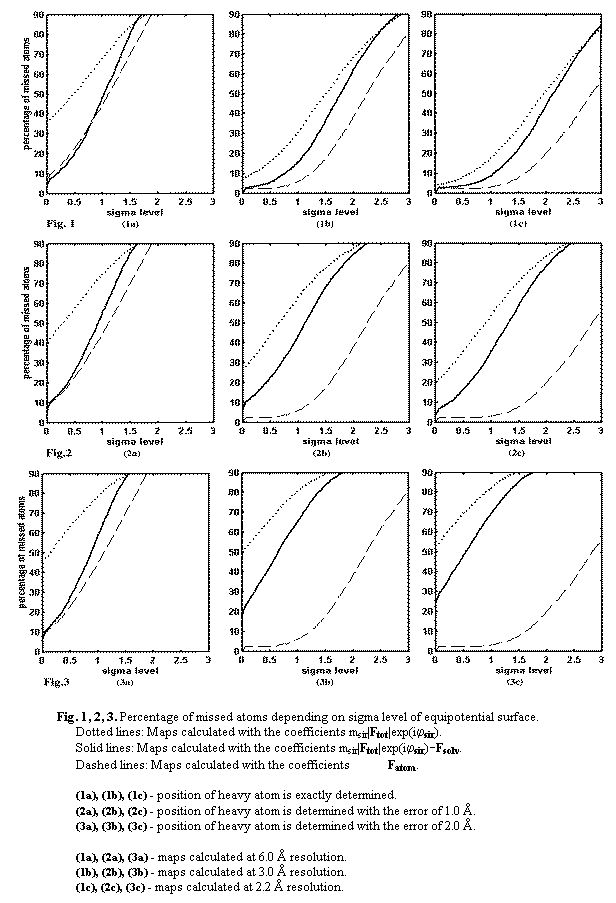
When Fourier syntheses r(r) are analysed, the objects of interest are the shape and localisation of equipotential surfaces rather than the absolute values of the density. The lower is the cut-off level r*, the larger is the region bounded by the surface r(r) = r*, the more atoms of the model are inside (trapped by) this region. On another hand, when comparing two synthesis taken at an equivalent level, the better one traps more atoms than the worse one. Therefore, the percentage of the missed atoms D(r) as a function of cut-off level can be used to estimate the quality of the syntheses as it is realised in the program MTRAP (Lunina & Lunin, personal communication). While originally in MTRAP the cut-off level is estimated through the relative volume of the selected region, for our tests we used more traditional measure in sigmas.
Results and discussion
Figure 1 illustrates the quality of the maps calculated at 6.0, 3.0, and
2.2 Å resolution with exactly assigned position of the heavy atom. The syntheses
with subtracted bulk solvent contribution are significantly better than
standard SIR syntheses (compare solid and dotted lines, Fig. 1). The effect of
the map improvement due to subtraction of the bulk solvent contribution depends
on the resolution and on the level of the equipotential surfaces. For the map
calculated at 6.0 Å resolution (Fig.1a) the improvement is significant for
levels in the interval 0-1 s, and for maps calculated at 3.0 Å and 2.2 Å resolution (Figs. 1b,
1c) the improvement is significant for
levels in the interval 0-1.5 s. At higher levels we will see only a small number of strong peaks
corresponding to clearly observed atoms. The improvement is maximal for the SIR
synthesis calculated at 6.0 Å resolution (compare solid and dotted lines, Fig.
1a). For example, at 0.5 s the percentage of missed atoms for SIR synthesis is 50 but for the
synthesis with subtracted bulk solvent contribution it is less than 20. This is
not surprising because the bulk solvent contribution is very significant at low
resolution.
The
maps calculated with 1.0 Å error in the heavy atom position (Fig. 2) are of
lower quality than the corresponding SIR maps calculated with the exact position
of the heavy atom (compare dotted lines at Figs. 1 and 2). Higher-resolution
SIR syntheses are quite sensitive to this error; for example, at 1.0 s the share of missed atoms
in the SIR synthesis calculated at 2.2 Å resolution increases from 20% to 50%
(dotted lines, Figs. 1c and 2c). On the other hand the quality of the SIR map
calculated at 6.0 Å resolution does not change significantly (dotted lines,
Figs. 1a and 2a). As previously for the exact heavy atom position, the
subtraction of the bulk solvent contribution significantly improves the maps
quality (compare dotted and solid lines Fig. 2a, 2b, 2c).
Because low resolution phases are less sensitive to the error in the heavy-atom position, when this error reaches 2.0 Å (Fig. 3) the quality of the SIR map calculated at 6.0 Å resolution becomes even better then the quality of SIR maps calculated at 3.0 Å and 2.2 Å. The most significant improvement after subtraction of the bulk solvent contribution corresponds also to the 6.0 Å resolution synthesis.
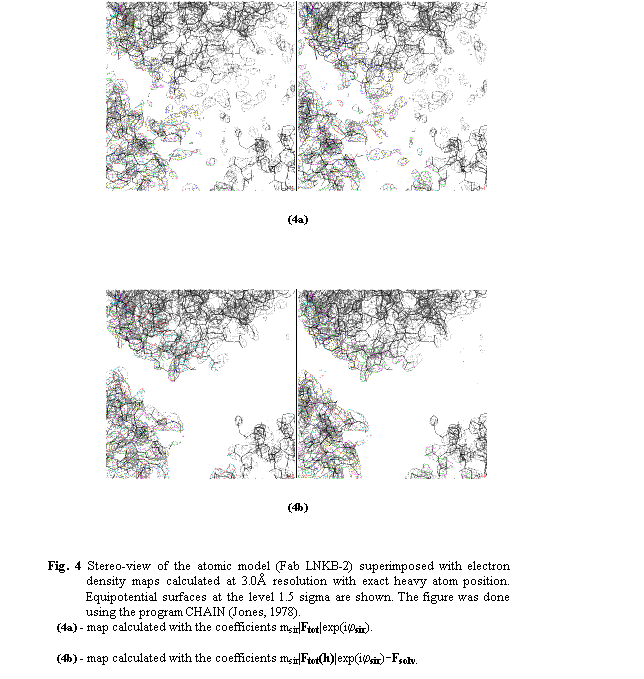
Fig. 4a shows the SIR electron density map and the atomic model
superimposed. The map contains many noisy peaks in the solvent region. After
subtraction of the bulk solvent contribution practically all these peaks in the
solvent region disappear (Fig. 4b) which is not surprising. More important is
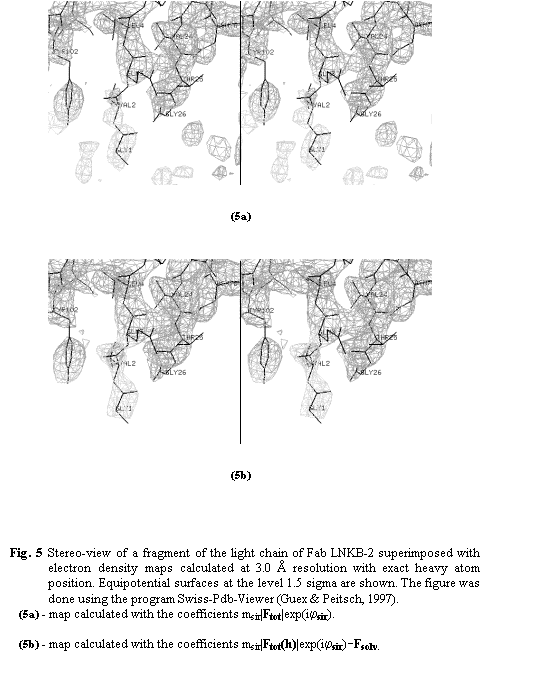
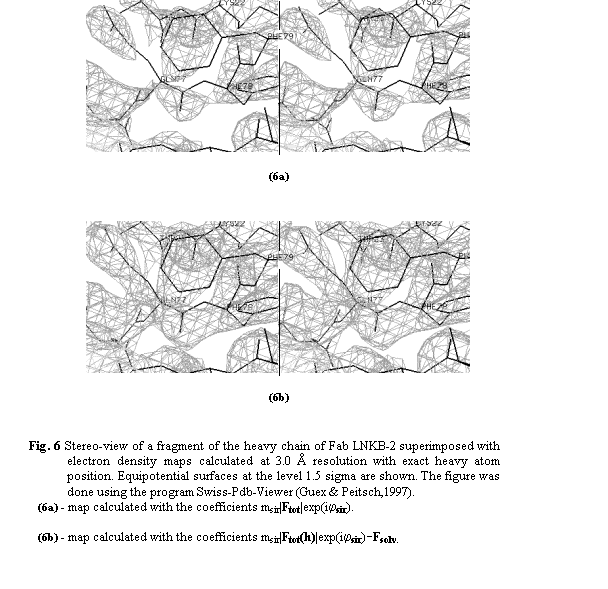
that the map becomes better in the regions of the macromolecule as illustrated
in more details in Figs. 5 and 6. A region of the light chain of Fab fragment is shown in the SIR map (Fig.
5a) and in the map with the subtracted bulk solvent contribution (Fig. 5b).
After the correction many noisy peaks disappear from the map and the correct
electron density appears for residues Gly1 and Val2 where it was absent
previously. The same maps show also a significant improvement of the image
quality in the region of the heavy chain, for example for the residues Gln77
and Phe79 (Fig. 6).
It can be also noted that the subtraction of the solvent contribution
does not change the sharpness of the map; in all cases the maximum value of the
map expressed in sigmas is practically conserved. Therefore, the improvement of
the model trapping is indeed due to an improvement of molecular contours in the
map.
Conclusions
Our tests show that if the bulk solvent contribution to the diffraction
pattern is known at early stages of phasing, the quality of the electron
density maps can be significantly improved by subtraction of this contribution.
The most significant improvement is observed for syntheses calculated at low
resolution with large errors in heavy atom position, because the bulk solvent
contribution is more significant at low resolution and low resolution synthesis
are less sensitive to errors in the heavy atom position.
Currently, the bulk solvent contribution is estimated only when a
(preliminary) atomic model is available and used mostly to refine this model.
The use of the bulk solvent contribution for map correction needs to develop
more sophisticated methods for its estimation without use of atomic models
(work in progress).
The authors thank Prof. C. Lecomte
for his interest to the project and L. Torlay for technical help. The work was
supported through CPER, Pole ``Intellegence Logicielle''.
References
Blow, D.M. &
Rossmann M.G. (1961) Acta Cryst., 14, 1195-1202.
Brünger, A.T., Adams, P.D., Clore, G.M.,
DeLabo, W.L., Gros, P., Grosse-Kunstleve, R.W., Jiang, J.-S., Kuszewski, J.,
Nilges, M., Pannu, N.S., Read, R.J., Rice, L.M., Simonson, T. & Warren,
G.L. (1998) Acta Cryst., D54, 905-921.
Fokine, A.V., Afonine, P.V., Mikhailova, I.Yu., Tsygannik, I.N.,
Mareeva, T.Yu., Nesmeyanov, V.A., Pangborn, W., Li, N., Duax, W., Siszak, E.,
Pletnev, V.Z. (2000). Rus. J. Bioorgan.
Chem., 26, 512-519.
Guex, N. & Peitsch, M.C. (1997) Electrophoresis,
18, 2714-2723.
Jiang, J.S. &
Brünger A.T.(1994) J. Mol. Biol., 243, 100-115.
Jones, T.A. (1978) J. Appl. Crystallogr., 11, 268-272.
Urzhumtsev, A.G. (1991) Acta Cryst., A47, 794-801
Urzhumtsev, A.G. (2000) CCP4 Newsletter on Protein Crystallography, 38, 38-49.
Figures


Newsletter contents...