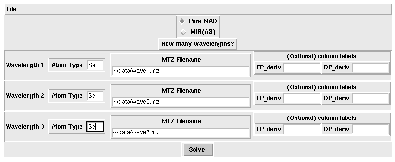
Figure 1: Chart main widget
Paul Emsley
| Chart 1 is a wrapper for SHELXS and the CCP4 Program Suite that creates (density modified) MIR(AS) or MAD 2 maps suitable for density fitting. 3 The starting point is MIR(AS) data sets. Chart terminates with what it considers to be an optimal density modified map. Chart has a minimalist GUI, which should be suitable for novice crystallographers and hopefully can be easily integrated with ccp4i. 4 Chart incorporates a ``divide and conquer'' procedure to optimize various parameters, such as resolution limits or best solvent content. |
The procedure of creating an initial map from MIR(AS) or MAD data is beset with traps for the novice crystallographer (and others not so novice). This program attempts to remove the drudge and pitfalls of heavy atom structure solution. I am aiming for a 90% success rate (i.e. Chart finds an acceptable map for at least 90% of soluble cases). Chart may create a final map that is worse than an experienced SHARP user could create. But it will create it much quicker.
Chart first uses the Patterson overlap method implemented in SHELXS to find initial heavy atom positions, running over various resolution ranges (typically more than one would do ``by hand''). Acceptable SHELXS solutions are then exhausively refined with MLPHARE. Atoms that refine well are combined. A cross-phased difference Fourier is synthesised and peaks checked to search for other derivatives. The solutions are then combined and the phases passed to DM. DM parameters are optimised for the best map. 5
One needs to specify:
Figure 1: Chart main widget
As you would expect for a program that solves structures, Chart uses many programs of the CCP4 Program Suite. Most heavily used is MLPHARE.
Chart creates conventional csh ``com'' and ``log'' files for programs in the CCP4 suite, so that it makes it easy to see what is going on with the refinements and so that you can tweak the refinement after Chart has finished (e.g. by adding, for example, new derivative sites or reducing the solvent content). Chart may not infallibly get all parameters correct.
Chart comes in two parts (at the time of writing). chart.scsh is code for the Scheme shell, scsh, and chart.stk is code for the GUI written for STk 6 (Scheme with Tk extensions). Hopefully soon I will be able to integrate the two by using guile, a Scheme interpreter with both scsh shell and Tk extensions. You will of course need both STk and scsh if you wish to use the interpreters, but binary distributions 7 for various sytems will be provided on the web site, for those wishing to avoid these compilation/installation steps.
The current implementation of chart runs CCP4 programs single-threadedly in the foreground. However, Chart can be changed to submit multiple jobs to remote processors 8. Chart is intensely parallelizable. Basically speed is proportional to the number of nodes or processors. I imagine that one could solve typical 50kD proteins in less than 5 minutes with 10 or so nodes i.e. processors).
The execution time is dominated by the time taken to run the CCP4 programs. The time spent in the shell is trivial in comparison.
| Molecule | Size | Space Group | Notes | Time |
|---|---|---|---|---|
| Shikimate Kinase | 19KD | P41212 | Dimer in AU | 1hr 50 minutes |
| MIP-1 alpha | 7.8kD | P3121 | 38 minutes |
Table 1: Sample execution times. Calculations performed on single processor, single node 333MHz Pentium II processor, running RedHat Linux 5.0, using CCP4 Program Suite 3.4 compiled with GNU Fortran 0.5.24-19980804 g77.
I have not tested the program with MAD data, although I hope to soon. Some changes will be needed of course, but largely the procedure remains unchanged. I need to include an interface to rantan and revise.
Chart is copyright Paul Emsley and is released under the GNU GPL. It will be available for free.
At the time of writing, Chart has not been released to the general public. It may have been by the time you read this however, but I don't want to release a first version that is very broken. See the web site for more details and updates:
http://www.chem.gla.ac.uk/~paule/chart
1 The name ``Chart'' has a rather contrived expanded
form: Characterising Heavy Atoms and Refining Them, it is also the
latinization of
![]() (Xartes), the Greek for ``maps''.
(Xartes), the Greek for ``maps''.
2 Not at the moment.
3 In the style described in the article in CCP4 newsletter 35 by L.M. Urzhumtseva & A.G. Urzhumtsev (see http://www.dl.ac.uk/CCP/CCP4/newsletter35/tcltk_software.html).
4 The CCP4 GUI, work in progress.
5 Will be, that is.
6 STk is free software and scsh is available for free to academics but companies pay (although I believe this licence is changing).
7 I use GNU/Linux to develop Chart, which probably means that that system will be best supported.
8 These remote machines must have the same directory (typically $CCP4_SCR) at the same mount points (but that's a natural consequence, if one uses automount).