Contents
(Mis)Using the PDB File Temperature Factor ColumnList the PDB File
Labelling the atoms with the data values.
Colouring by 'Temperature Factor'
Selecting residues with a range of data values
Colouring residues with a range of data values
 |
CCP4 Molecular Graphics Tutorials | |
| Importing Model Analysis Data |
| Documentation Contents | On-line Documentation | Tutorials | CCP4mg Home |
It is common practise for programs to output a variety of data to the temperature factor column of a PDB file - that is characters 61 to 66 of the lines beginning with the word 'ATOM'. CCP4mg will read such a PDB file and can display the data by various means. Load the PDB file 1df7_consurf.pdb which contains the output from the ConSurf server for 1df7.pdb with the conservation of residues listed in the temperature factor column. The file pdb1df7.aln shows the sequence alignment for 50 homologous dihydrofolate reductase structures and the consurf value in the PDB file indicates the degree of conservation for each residue in structure. The lower the consurf value the more strongly conserved the residue. Listed below are some ways of viewing that data.
Since the non-peptide atoms do not have a consurf value and, in fact, still have the 'correct' temparature factor which might be confusing, exclude them from the display by changing Atom selection to All peptide.
From the model data object icon menu (![]() ) select List data. A window listing the PDB file appears. Scroll down to the lines which begin with the word 'ATOM'. Note that the 'temperature factor' values are the same for all atoms in one residue.
) select List data. A window listing the PDB file appears. Scroll down to the lines which begin with the word 'ATOM'. Note that the 'temperature factor' values are the same for all atoms in one residue.
Click on the model display object icon menu ![]() and select Atom labels and One atom/residue to label just the CA atoms (all the atoms in one residue have the same value). Go to the Atom labels menu again and select Details... In the new window uncheck the labelling of Chain and Residue (or whatever is currently on) and check the labelling of Temperature factor. The residues are now labelled with the conservation value. To switch off the labels go back to the Atom labels menu and select no atoms.
and select Atom labels and One atom/residue to label just the CA atoms (all the atoms in one residue have the same value). Go to the Atom labels menu again and select Details... In the new window uncheck the labelling of Chain and Residue (or whatever is currently on) and check the labelling of Temperature factor. The residues are now labelled with the conservation value. To switch off the labels go back to the Atom labels menu and select no atoms.
Firstly, you might need to change the display style to something like Bonds or Cylinders to see the individual atoms.
From the Colour Scheme menu select Atom properties and Temperature factor. The model will probably be redrawn in green and blue in a way that is not very helpful because the values of the consurf parameter are not in the same ranges as usual temperature factors. The colouring scheme for the 'temperature factor' can be changed in the Preferences window (bottom of the Edit menu). Look in the Model colours folder for Temperature factor. Change the Data values for the colour ranges to be:
-1.5 : blue
0.0 : white
6.0 : red
The peptide atoms will be coloured by blue to white to red depending on their consurf value of their residue. Non-peptide atoms are coloured yellow. If the model is drawn in display style Ribbons then it looks like this:

Restore the display style to Bonds. To select only those residues with 'temperature factors' in a given range of values go to the Atom Selection menu and open the Selection browser. From the menu at the top right of the selection browser window select properties and then in the new section of the window click the Add line button.

There is now a line to set selection by a criteria which is, by default, Temperature factor so you can just enter upper and lower range values in the two text boxes - for example enter '-1.5' in the lower range value and '0.0' in the upper range value and then click Apply to display only the conserved residues.
In the previous example of colouring by 'Temperature Factor' the colours are blended between blue and white or between white and red. In this example the residues are grouped into ranges of data values and all residues within a given range are given the same colour.
Revert Atom selection to All peptide. From the Colour scheme menu select Edit colour scheme... In the new window click on the Add line line a couple of times so that you have two lines in the window in which you can select two sets of residues and give them a colour.

Click on the lassoo button (![]() ) and select Property from the menu and in the first row of the new window enter -1.5 and 0.0 to select atoms with 'Temperature factor' (i.e. consurf values) in this range. Click on Apply. Back in the Edit colour scheme window select a colour for these first set of atoms. Now select a second set of atoms with 'Temperature factor' values in the range 0.0 to 6.0 and give them a different colour. This has created only two groups - obviously you could create more. To save this customised colour scheme click the Save button and in the new window enter a name and click Save. You can now see the newly saved colour scheme listed in the Restore section at the top of the Edit colour scheme window and it can be restored from here at any time in the future.
) and select Property from the menu and in the first row of the new window enter -1.5 and 0.0 to select atoms with 'Temperature factor' (i.e. consurf values) in this range. Click on Apply. Back in the Edit colour scheme window select a colour for these first set of atoms. Now select a second set of atoms with 'Temperature factor' values in the range 0.0 to 6.0 and give them a different colour. This has created only two groups - obviously you could create more. To save this customised colour scheme click the Save button and in the new window enter a name and click Save. You can now see the newly saved colour scheme listed in the Restore section at the top of the Edit colour scheme window and it can be restored from here at any time in the future.
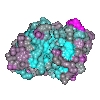
Displaying the peptide as spheres and adding another model object to display the inhibitor and cofactor as cylinders gives the following picture which shows the conserved residues, in magenta, around the ligand binding sites.
