Contents>
Introduction
Monomers Table
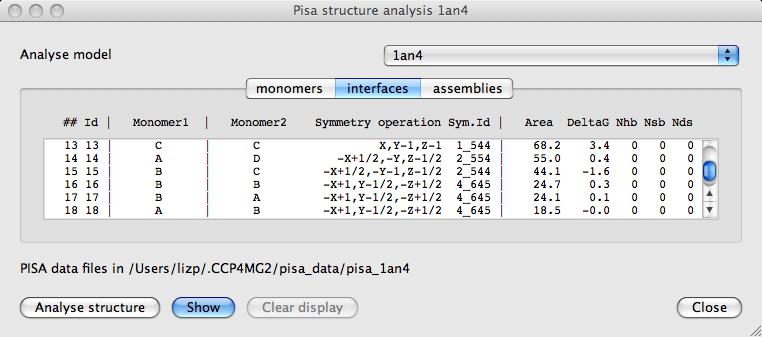
Interfaces Table
Program Notes

|
CCP4 Molecular Graphics Documentation | |
| PISA Analysis of Model Interfaces |
| Documentation Contents | On-line Documentation | Tutorials | CCP4mg Home |
The PISA program analyses crystal structures to identify the component chemical monomers and the interfaces between the monomers including the monomers generated by applying symmetry to the input file coordinates. PISA will also evaluate the strength of interaction between the neighbouring monomers in a crystal and predict what would be the most stable multimer and therefore the most likely biological form of the structure.
PISA is available as an EBI web service where there is more information. If you publish results based on PISA analysis please cite. The PISA program is distributed with CCP4mg. The CCP4mg interface to PISA can be found on the Applications menu. If you have more than one model loaded select one from the combo box at the top of the interface and then click the Analyse button. There will be multiple runs of the PISA program to extract all the available information. Output files are saved in the directory your_home_directory/.CCP4MG2/pisa_data/pisa_name_of_model. The results are extracted from the files and saved in the name_of_model.ccp4mg file so the information is available in future without running PISA again.
The results are shown in three tables: monomers, interfaces and assemblies. The table columns are explained below.
Select a line in the Monomers or Interfaces table and click the Show button to see either the monomer highlighted or the two surfaces of the interface. The new display objects are shown on the Display Table and can be further manipulated from there. For example surfaces can be coloured by electrostatics or atom type. These display objects created by the Pisa interface can be removed by clicking the Clear display button.
For interfaces to a symmetry-releated monomer the program will edit the model data to add a copy of the entire structure with the appropriate symmetry transformation applied. Symmetry-transformed copies of the data are given the same chain, residue and atom names as the original structure but are identified by a different model number. This is the model number usually used to identify different NMR structures in a PDB file - see the description of coordinate ids. Symmetry-transformed copies can also be generated by the Generate symmetry mates tool on the model icon menu. If you need to select the different symmetry mates for display or colouring use the NMR/symmetry models tab on the selection browser interface.
##The row number
IdThe row number
Monomer indicates the selection range for the respective structure. In case of full monomeric chains, the range is simply a chain ID as annotated in the corresponding PDB or user-uploaded file. Full chains without chain ID are denoted as {-}. Ligands are denoted as [R]C:N where R is residue (ligand) name, C is chain ID and N is residue number. For example, [HEM]-:605 means protoporhyrin IX containing Fe (HEM) in chain without a chain ID, residue number 605.
Class indicates the chemical class of the structure. The class may be either Protein (aminoacid chains), DNA/RNA (nucleic acid chains) or Ligand (small molecules, which are not a solvent).
Nat indicates the total number of atoms in the corresponding structure.
Nres indicates the total number of residues in the corresponding structure.
Sat indicates the total number of surface atoms in the corresponding structure.
Sres indicates the total number of surface-exposed residues in the corresponding structure.
Area indicates the solvent-accessible surface area of the corresponding structure, in Å2. The algorithm of surface area calculations employs a space discretisation, which makes the results to depend slightly on molecule orientation. It is therefore normal to see slightly different surface areas for identical structures in the same entry.
DeltaG indicates the solvation free energy of folding for the corresponding structure, in kcal/M.
## The row number
Id The row number
Monomer1 indicates the selection range for the respective interfacing structure. In case of full monomeric chains, the range is simply a chain ID as annotated in the corresponding PDB or user-uploaded file. Full chains without chain ID are denoted as {-}. Ligands are denoted as [R]C:N where R is residue (ligand) name, C is chain ID and N is residue number. For example, [HEM]-:605 means protoporhyrin IX containing Fe (HEM) in chain without a chain ID, residue number 605. In case of monomeric chains being generated by NCS (non-crystallographic symmetry) operations given in the PDB entry or uploaded file, the symmetry mates are specified as nX where X is the original selection range and n is the serial number of NCS operation (which corresponds to records "MTRIXi n" in PDB file).
Monomer2 As Monomer1.
Symmetry operation indicates the symmetry operation that should be applied to 2nd interfacing structure in order to obtain the respective interface. The symmetry operation is specified in fractional space relatively to the structure position as given in the corresponding PDB or user-uploaded file.
Sym.Id indicates the symmetry operation that should be applied to 2nd interfacing structure in order to obtain the respective interface. The symmetry operation is specified in fractional space relatively to the structure position as given in the corresponding PDB or user-uploaded file.
Area in A2, calculated as difference in total accessible surface areas of isolated and interfacing structures divided by two.
Delta G indicates the solvation free energy gain upon formation of the interface, in kcal/M. The value is calculated as difference in total solvation energies of isolated and interfacing structures. Negative G corresponds to hydrophobic interfaces, or positive protein affinity. This value does not include the effect of satisfied hydrogen bonds and salt bridges across the interface.
Nhb indicates the number of potential hydrogen bonds across the interface. Each hydrogen bond contributes about 0.5 kcal/mol into the free energy of protein binding (exact value depends on the calibration procedure and may change with version number).
Nsb indicates the number of potential salt bridges across the interface. Each salt bridge contributes about 0.3 kcal/mol into the free energy of protein binding (exact value depends on the calibration procedure and may change with version number).
Nds indicates the number of potential disulfide bonds across the interface. Each salt bridge contributes about 4.0 kcal/mol into the free energy of protein binding (exact value depends on the calibration procedure and may change with version number).
The version of PISA distributed with CCP4mg has been slightly modified to:
List symids according to the order of operations in the CCP4 syminfo.lib file.
Not attempt to launch a CCP4mg process after creating a CCP4mg command file.
Using an alternative version of PISA with CCP4mg will result in
symmetry mates being displayed wrongly.
E. Krissinel and K. Henrick (2007). Inference of macromolecular assemblies from crystalline state. J. Mol. Biol. 372, 774--797.
PDF of before review version of this paper