Contents
Loading a Map or MTZ FileThe Contour Display Object
Map Slices
Customising the Map Display
Map drawing style preferences
See also the tutorial on electron density maps.
 |
CCP4 Molecular Graphics Documentation | |
| Electron Density Maps |
| Documentation Contents | On-line Documentation | Tutorials | CCP4mg Home |
An electron density map can be read from a CCP4 map file or an MTZ experimental data file. Loading an MTZ file is slower as the map needs to be calculated but there is an option to recalculate the map with a different grid spacing which can be useful in creating the optimum image. Other experimental data formats can be converted to MTZ using the Convert to MTZ and Standardise task in the CCP4i interface; this can be found in the Reflection Data Utilities module.
This window appears when reading an MTZ file
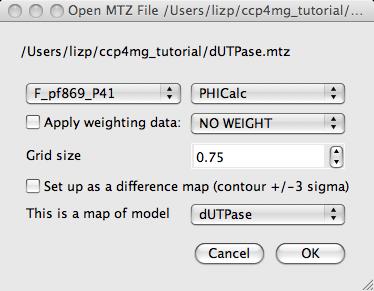
You need to select structure factor (F) and phase (PHI) column data and optionally, weight column data, to calculate the map.
The default map grid size of 0.75 Å is appropriate for model building work but a higher resolution (i.e. smaller grid size) may give a better picture but slower performance.
If the Set up as difference map option is on then the map will initially be drawn with two contour levels and +/- 3 sigma.
If there are model(s) loaded then there is an option to specify which model is associated with the map. This model will then be treated as part of the crystal and symmetry related models will be generated (see the Crystal documentation).
After the map is loaded the map data object is listed in the display table and a Crystal object is also listed. This object is mostly concerned with the display of the model(s) in the crystal and is described here.
The map display object is the contour level that is displayed as chicken-wire by default. In the display table the three main options for the map contours display are
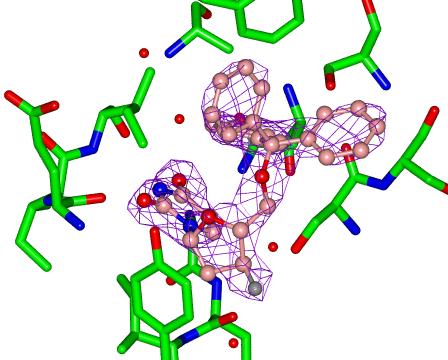
There are various options to control how much of the contour surface is displayed. By default a 10Å box is shown at the centre of the display. The size of this box can be reset. The electron density can also be clipped to show only the density within a given distance of a selected set of atoms. The Clip.. sub-menu lists all of the model display objects for models associated with the map and if you choose one of these then the map will be clipped to the atoms in that display object. An example of map clipping is shown below. There is a model display object which has a ligand selected and displayed in pink. This display object can be selected from the Clip.. sub-menu to give the picture shown below. The display object can be hidden if it is not required in the picture.
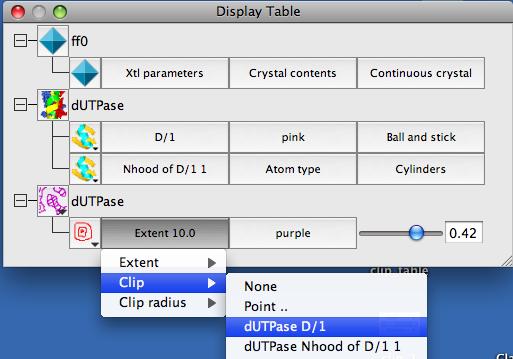
The Clip radius option can be used to fine tune the extent of the density.
There is a menu of all currently defined colours and options to add a new colour or edit the present colour.
A slider bar controls the contour level. By default, the contour level value is reported in the absolute value of electrons/Å3.
The contour surface is shown as chicken-wire but this can be changed by clicking on the map display object icon  and selecting Surface style.. and then one of
On the map display object icon menu , the Surface style.. option menu includes Contour Slice and Mask which draw a 2D plane through the map. The map slice shows contours and the mask is a solid plane with grid squares coloured by the density value at that grid point. The extent of the plane is controlled by the options on the Map extent menu (left hand column of display table) and the maximum density cutoff for the contours or mask is controlled by the Contour Level slider bar in the right hand column of the display table. Other options are controlled by the Contour slice details.. option on the icon menu.
The Contour slice details.. window has the following options:
Contour spacing Set the slice contour spacing.
Define plane has options:
through selected atoms for which you choose three atoms
parallel to crystal face which gives a choice of crystal faces
specifying plane which requires three values to define a plane
For the last two cases the input defines the orientation of the plane but the position is set to the centre of the current display.
To get smoother contouring or a less coarse grid in the mask it may be helpful to reduce the Map grid size - this can be done from the map icon menu (the dot next to the map name). If a slice or mask is not displayed check that the Contour level on the display table is set fairly high and that the Contour spacing (in the Contour slice details window) is set fine enough.
Map grid size on the map icon menu can be used to change the grid spacing if the data was loaded from and MTZ file.
The default initial appearance of the contour display object can be changed in the Preferences window (at the bottom of the Tools menu) - look in the Maps folder on the Preferences window.
Look in the Maps folder of the Preferences window for options to control the default appearance of electron density cntour objects.
The sampling rate is applied when generating maps from experimental data (MTZ files) and is the resolution of the map. The default value of 0.75 is quite coarse, values like 0.5 will give more attractive, but slower, pictures.
The Map extent is the size of the initially drawn cube of density; the extent can be changed for the individual contour objects in the left (selection) column of the display table.
Surface drawing style can be chicken wire, solid, dots or cylinders. This can be changed for individual contour objects via the icon menu.
Contour scale can be absolute (in electrons/Å3) or sigma values. This controls the labelling of the contour level slider in the right column of the display table.
The Max/min contouring level for the slider is +/-6 sigma by default.
First/second contour colour set the initial colour of the first and the second contour objects for one map.
Maximum dot density and Dot size control the appearance contour level drawn in dots style.