Contents
Loading a map and modelBetter map representation for making images
Packing diagrams
 |
CCP4 Molecular Graphics Tutorials | |
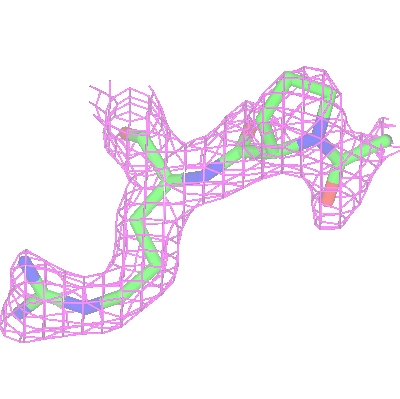
| Electron density maps |
| Documentation Contents | On-line Documentation | Tutorials | CCP4mg Home |
Load the coordinate file toxd.pdb with the picture wizard style set to Bonds : all atoms. Then load the CCP4 MTZ (structure factor) file toxd_sfall1.mtz. In the new window you can select the structure factor and phase data from the file - accept the defaults by clicking OK. The map will be calculated and displayed.
The display table will then look like this:
There are rows for the loaded coordinate and map data and also a row for a Crystal.
The display style is 'Continuous crystal' by default; to understand
this try holding down the middle mouse button and
dragging around the screen - the map will update automatically to cover the
area at the centre of the screen and symmetry related models will appear when
necessary. (If the symmetry models do not appear then look at the menu
labelled Crystal contents and make sure that the toxd is checked
'on').
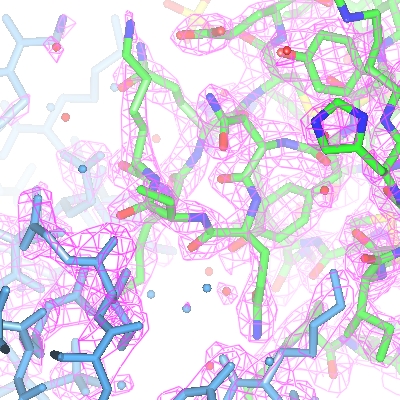
For the map display object the contour level has a slider which can be used to changed the contouring level. The scale is in an absolute scale of electrons/A3 but this can be changed to sigma levels (and other defaults can be changed) in Map options on the Preferences window (access this from the Tools pull-down menu).
The map display style can be changed by clicking the display object icon
 , selecting Surface style.. and then selecting an alternative to the conventional default chicken-wire style. Cylinders style is useful for creating distinct electron density maps for making images.
The appearance of the map can also be improved by reducing the map grid size. If you loaded data from a map file then the grid size is fixed in the file but if you loaded data from an MTZ file then try clicking on the map icon and then select Sampling rate from the menu. Try resetting the grid size to 0.5 - there will be a short delay whilst the map is recalculated.
Another way to simplify an image is to show just the map around the
features of interest and clip out extraneous density. To demonstrate
this first create an new display object for the toxd model
(click on the model icon and select Add model display object) and
then select a small number of residues using the selection browser. Displaying these residues in Cylinders style
will improve the picture. You may need to find these residues on the
display by choosing Centre on from the display object icon menu
![]() .
.
Now to display just the density around these residues click on
the map Extent menu and select Clip.. and the selected residues.
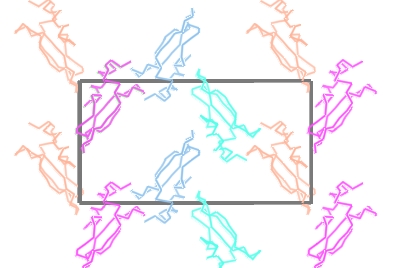
To show the packing of the molecule in the crystal first hide the map by unchecking Visible from the map display icon menu and then change the Crystal Display style from 'Continuous crystal' to Contents of one unit cell. All the symmetry models necessary to fill a unit cell will be displayed. The Cell edges can also be toggled on from the Crystal Display style menu. The image may be clearer if you change the atom selection for the toxd model to CA trace. Clicking on the ![]() icon of the crystal object and selecting Align view on will allow you to align the view on a particular crystal plane.
icon of the crystal object and selecting Align view on will allow you to align the view on a particular crystal plane.