Initial notes on visualiser
These notes are intended to act as a starting point for developing
the visualisation component of the BIOXHIT db work.
Questions to think about:
- What data do we want to visualise?
- What are the purposes of visualising the data?
- What kinds of views could we use?
- What are the implementation issues?
The Data
The BIOXHIT db was originally intended as a tracking/history db.
So the data that we should think about visualising initially should
be history data. This could be job history or
data history.
- Job History: projects are composed of jobs (programs run or
steps performed), so what we would like to see are how the different
jobs are related within the project.
- Data History: within a project data is created (or imported),
used, and possibly modified. So data history would be useful to
understand the provenance of the data and how it was used.
CCP4i doesn't store explicit history data so this would need to
be derived somehow. Experiments with inferring data history from
input and output files of jobs seems to yeild promising results. A
richer database should provide a way to record explicit history data.
Purposes Of Visualisation
- Better understand the course of the structure determination,
particularly if returning to it after a gap
- Locate a particular file or data item
- Gather information for deposition of final structure
Possible Views Of The Data
Below are some possible views of the history and job data
that we could consider. It is possible that we could consider
more than one view, and that a visualiser might allow combining
these in some way - for example, clicking on a job line in the
listbox view might display a single job view
for the selected job.
|

|
Current CCP4i view: listbox
This is the most basic view - jobs listed in order
of job id number (essentially chronological order).
Each line displays id number, date/time, taskname,
title and status.
A more advanced listbox could be envisaged. This
would look like the current one but would have
additional features similar e.g. to Outlook email -
allowing the user to select which columns of data
they want to see (or not see), sort on different
columns in ascending and descending order etc.
|
|
|
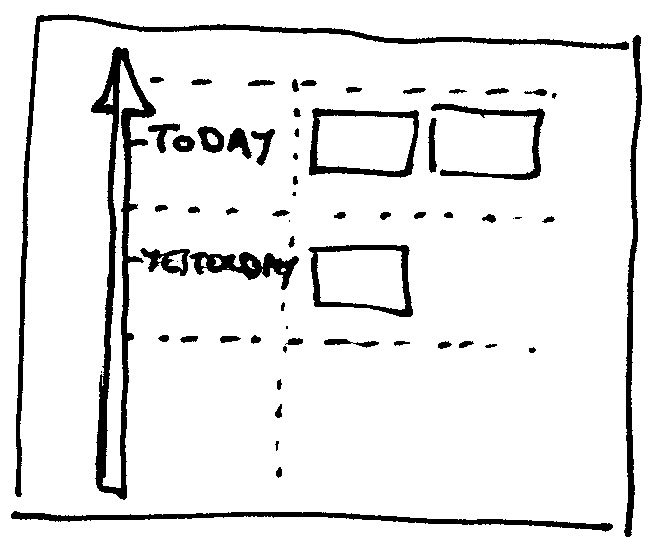
Timeline view
This would show jobs or data items in some
chronological context, e.g. in a calendar or a
"timeline". It would help the user browse for jobs or
data by associating them with dates etc. Probably
not useful as a principal view but might be worth
considering as an additional view in future.
|
|
|
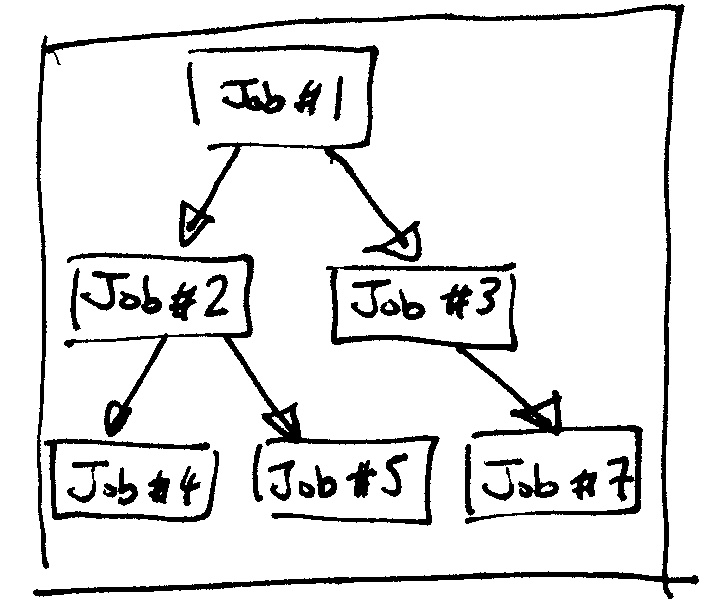
Graph view
This is the kind of view that we have already
experimented with. The graphs can be generated using
the graphviz package, and show jobs or data items
connected by arrows or lines indicating how they
are related.
(A variation on this would be a Path view,
where the user selects a particular job and then
only sees the other jobs that are related to it.)
|
|
|
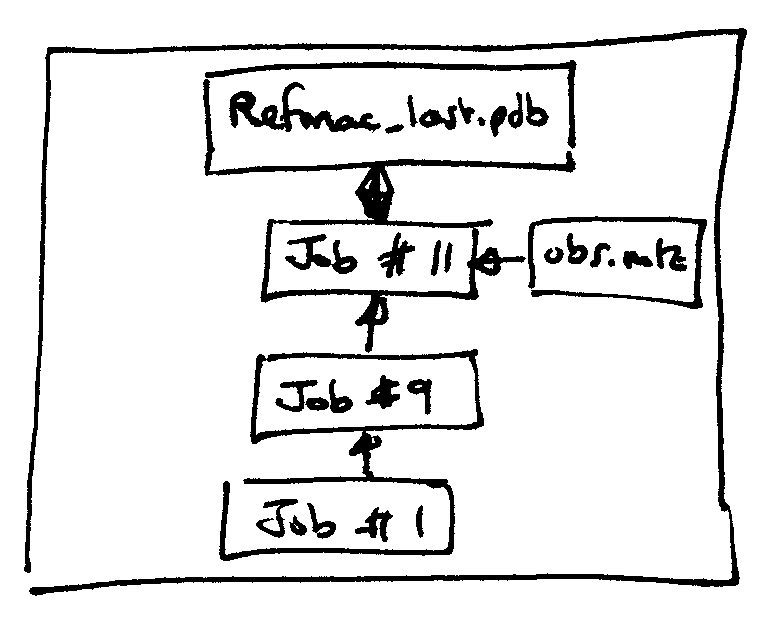
Data view
This is similar to the "graph" view, except that
it shows relationships based on a single data
item. The idea would be that the user would select
a data item (most likely a file) and then would
see the jobs (and maybe data) that were used to
generate the data.
|
|
|
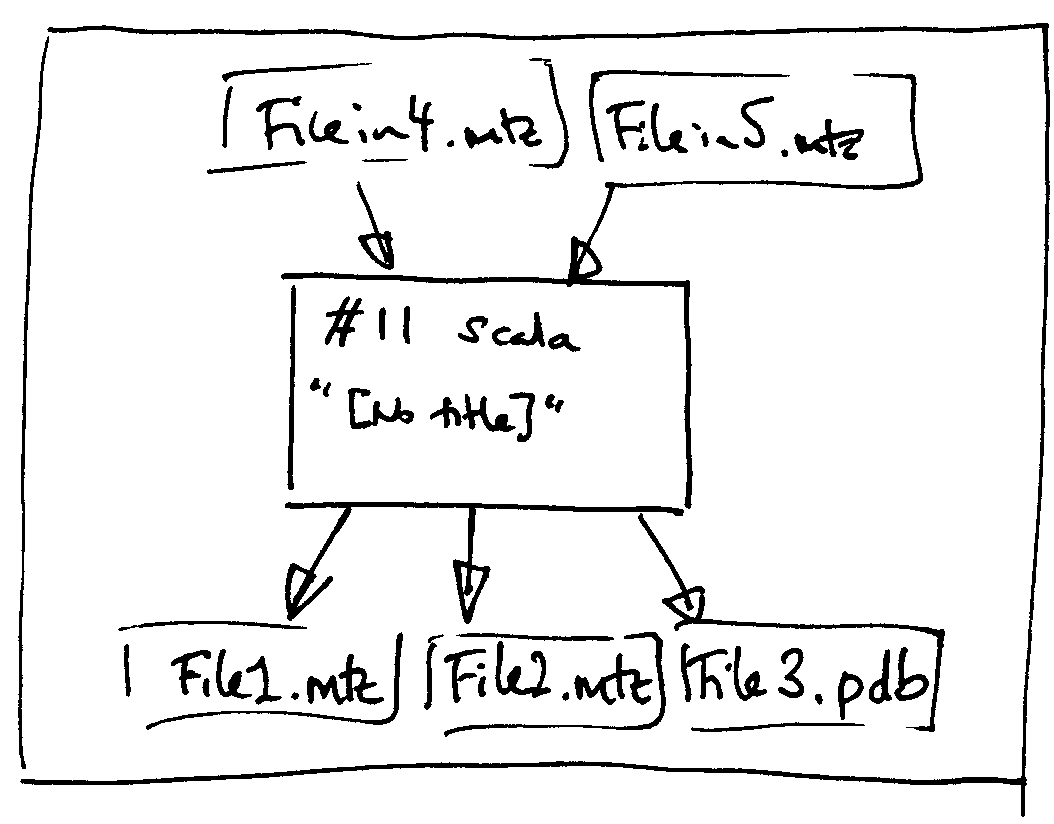
"Single job" view
Show just a single job, along with the associated input
and output files.
|
|
|
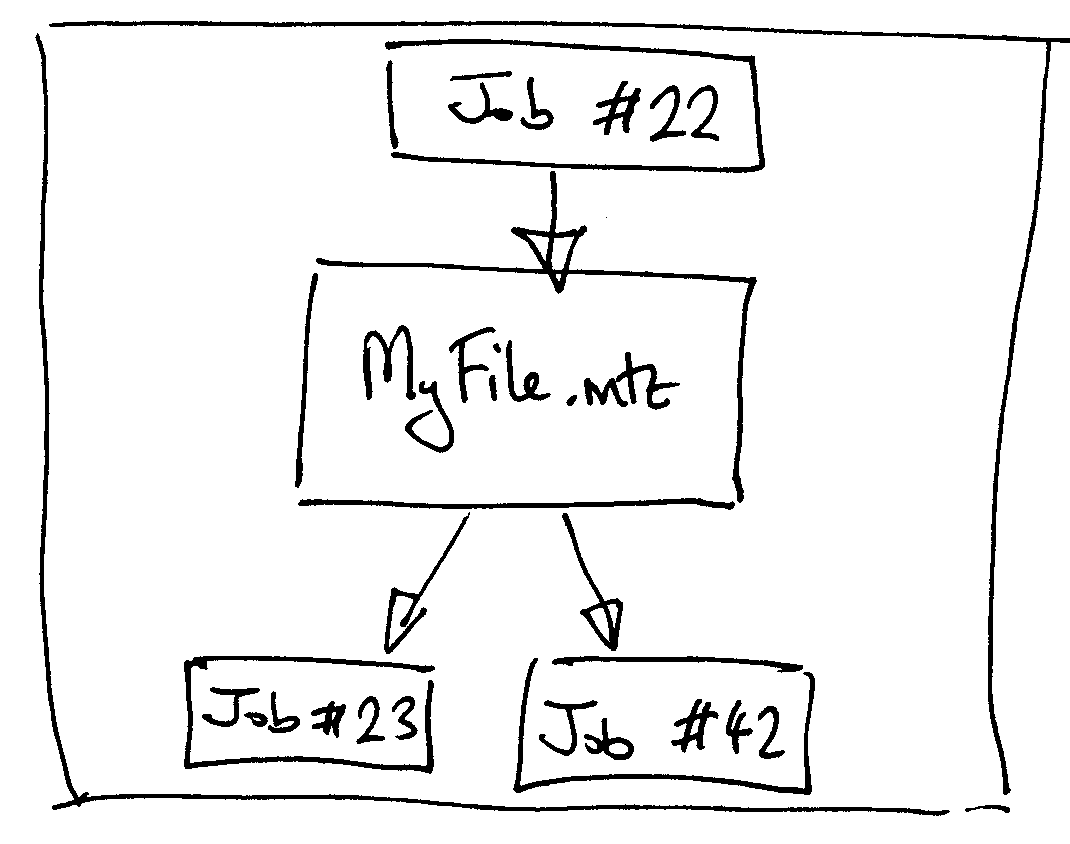
"Single file" view
Show just a single data item (file), with the job that
created it and any subsequent jobs that it was used by.
|
Other ideas/thoughts
-
Use colours and shapes to indicate the status of jobs,
for example a green box for a successful job, a red diamond
shape for a failed job.
-
In CCP4i there is a big problem with finding which job
is the one you actually want. We need more indicators
than just the taskname or title.
-
Use an icon to indicate that there is an associated
notebook entry for a particular job.
-
Provide a "summariser" application which will give a
summary description of any given file, e.g. the programs
listed in a logfile, the number of reflections and types of
data etc in an MTZ file, the number of atoms etc in a
PDB file and so on. (This might be particularly useful
for CIF files too).
-
Manually adding relationships: allow the user to
explicitly define or break relationships between
different jobs or data items, to enrich the history
view.
-
Deposition tool: extend the Graph view to
allow the user to select the jobs that represent the
final structure determination. For example - only one
REFMAC5 refinement job is permitted, only one SCALA
job and so on. The tool can then gather final model,
reflection data, harvest files etc and perform basic
consistency checks.
Implementation Issues
It would be nice to use Graphviz to generate our
graph views, but there are some issues that we need to
consider:
- Compatibility with CCP4i
- Cross-platform support
- Future maintainability (might affect choice of language)
- Redistribution restrictions on Graphviz package
- How to generate relationships between jobs/data
Peter Briggs 13th September 2007


