| 
|
| Example of untwinned data | Example of twinned data |
Twinning is a phenomenon where multiple domains with differing orientations form within a single crystal - I think of it as having several "sub-crystals" contained within a single sample, and the resulting diffraction images from such a twinned crystal will be made up of contributions from each of the sub-crystals.
There are different types of twinning:
This document outlines my understanding of how CCP4 programs can help in the case of dealing with merohedrally twinned data.
Hemihedral twinning can be characterised by two parameters:
The observed intensity from the twinned crystal is related to the intensities from each of the two domains:
Ihkl(twin) = α Ihkl(crystal1) + (1-α) Ih'k'l'(crystal2)
Depending on the value of α there are two possible situations:
For a perfect twin it is not possible to deconvolute the intensity data, however for a partial twin where α is not too close to 0.5 it is possible to deconvolute ("detwin") the data and perform a normal structure determination.
There are two tests that can be used to indicate twinning:
Both these quantities can be calculated using all reflections (to give a single number) and using a subset of reflections (in which can case for example the values can be plotted as a function of resolution).
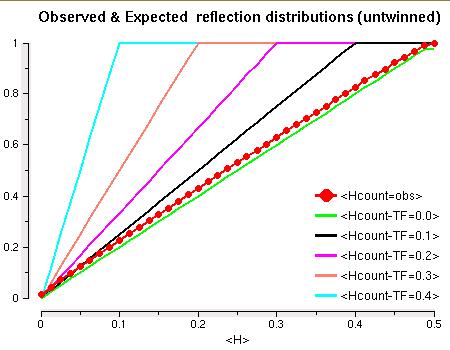
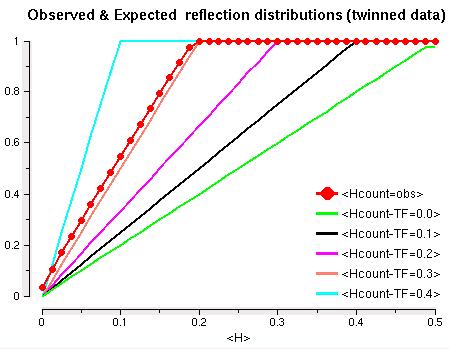
SFCHECK, DETWIN and TRUNCATE all calculate these values. Below are examples of the partial twinning test graphs from DETWIN, which plots the values derived from the observed data alongside the theoretical values for different possible twin fraction values.
|
|
|
| Example of untwinned data | Example of twinned data |
Both SFCHECK and DETWIN report the values of H for all reflections, plus the calculated value of the twin fraction. SFCHECK can be run inputing only the structure factor file, and will report if the data appear to be twinned. It will also automatically try all possible twin operators and report the most likely one. DETWIN requires the user to supply the twin operator, so if there is more than one possibility then you will have to try each one manually.
1. Certain spacegroup and cell dimensions can permit twinning
TRUNCATE issues a warning if it detects that this is the case:
 $TEXT:Warning: $$ comment $$
 WARNING:  **** Beware! - Cell dimensions could permit Twinning ****
 $$
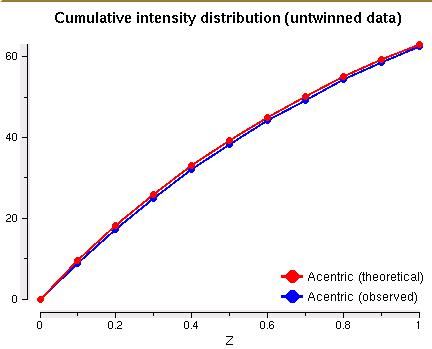
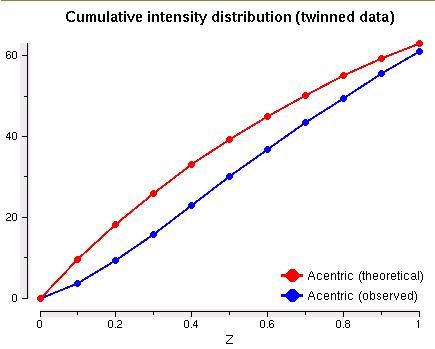
2. Plots of cumulative intensities
These distributions are generated by TRUNCATE, and become increasing sigmoidal for twinned data, for example:
| 
|
| Example of untwinned acentric data | Example of twinned acentric data |
TRUNCATE outputs both the theoretical and observed curves; significant deviation of the observed data from the prediction is an indication of problems. In the case of twinned data, the observed curve changes shape as there are fewer apparent "extreme" (strong and weak) intensities and more average values.
3. Higher moments of Z
These are related to the perfect twinning test, and are output from TRUNCATE plotted as functions of resolutions for centric and acentric data. The TRUNCATE documentation gives the predicted values which can then be compared against the calculated ones to give an indication of twinning.
4. Statistics from attempted detwinning
DETWIN outputs some useful graphs:
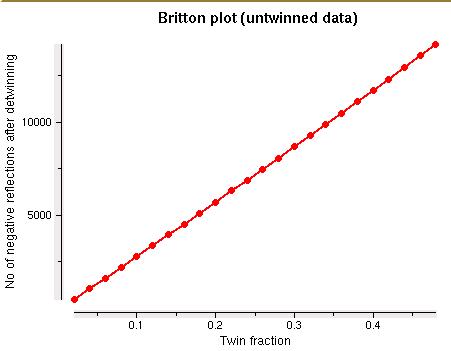
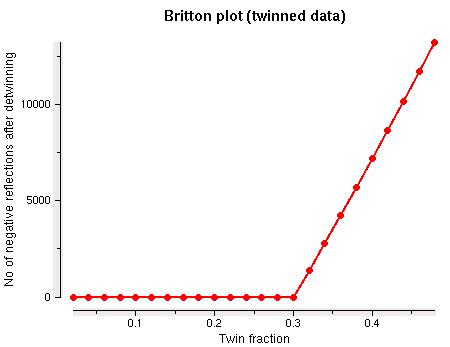
a) Britton Plot
The Britton plot is the number of negative intensities after detwinning as a function of the twin fraction α. If α is too small then there should be no negative intensities, if it is too large then this number should increase linearly.
Examples are given below for untwinned and twinned data:
| 
|
| Example of untwinned data | Example of twinned data |
These plots can give an indictaion of the twin fraction by looking at the largest value of α for which the number remains zero.
b) Correlations between intensities after detwinning
This determines the correlation between the intensities for the two domains after the detwinning process. At high resolution it is expected the value should drop to zero (unless an NCS operator related to the twin operator is present).
Both SFCHECK and DETWIN can be used to deconvolute the twinned data, provided that the twin fraction is not too close to 0.5 (perfect twinning). "Not too close" is not well defined, however SFCHECK applies a cutoff of 0.45 above which detwinning will not be attempted.
See the program documentation for more information on how to perform the detwinning step.
These are other places where you can find additional information on twinning: