Interactive Graphical Viewer and Browser for Reflection Data
Eugene Krissinela, Phil Evansb
aCCP4, Research Complex at Harwell, Rutherford Appleton Laboratory, Didcot OX11 0FA, UK
bMRC Laboratory of Molecular Biology, Hills Road, Cambridge CB2 0QH, UK
Reflection data analysis plays an important role in the structure solution process and is often an essential step in choosing the optimal data processing strategy. In CCP4, several programs provide for various aspects of data analysis, such as SFCHECK [1], CTRUNCATE [2], POINTLESS [3], SCALA [3], WILSON [4] and others.
Sometimes, a deeper inspection of reflection data is required, where direct access to all the content of an mtz file, both merged and unmerged, is needed. This is achieved with the help of various mtz utilities in CCP4, in particular MTZDUMP [5], and the graphical applications HKLPLOT [6] and HKLVIEW [7]. MTZDUMP provides a comprehensive inspection of reflection data, but it represents a command-prompt application and necessitates examination of extensive log files, which is inconvenient for a general user. HKLPLOT and HKLVIEW provide a graphical representation of reflection data, but they do not have all MTZDUMP capabilities and are technologically outmoded.
A new graphical application, VIEWHKL, has been developed, which aims to combine the comprehensiveness of MTZDUMP with the graphical convenience of HKLPLOT/HKLVIEW whilst bringing the latter to a modern level of graphical, user-friendly computing. VIEWHKL is written in C++ Qt (version 4.7 and higher), and makes extensive use of CCP4 Clipper library [8], where mtz-handling classes have been extended to deal also with unmerged files. The program utilizes multi-threading technologies in order to enhance user experience and keep GUI controls smoothly responsive while dealing with mtz files of significant size. VIEWHKL is fully portable to all platforms supported by Qt, and is included in CCP4 distributions for Mac OSX, Linux and Windows.
Figure 1 presents a general outlook of VIEWHKL. The program has 4 tabs for presenting different aspects of data: General, Summary, HKL List and HKL Zones, plus an additional tab named Batches in case of unmerged files. Upon loading a file with reflection data, header information is read first and displayed in the General tab. While loading some files may take as long as 10-15 seconds, the header information is displayed instantly. The tab presents data on general properties such as resolution range, cell parameters, number of reflections, and a list of data sets contained in the file with respective column labels and types.
The Summary tab (Figure 2) displays history records stored in the mtz header, as well as extended dataset summaries, which includes columns’ value ranges, number of missed reflections, completeness, mean values and resolution range. Each row of the table corresponds to an mtz column; columns are grouped by type and shown in alternating colours.
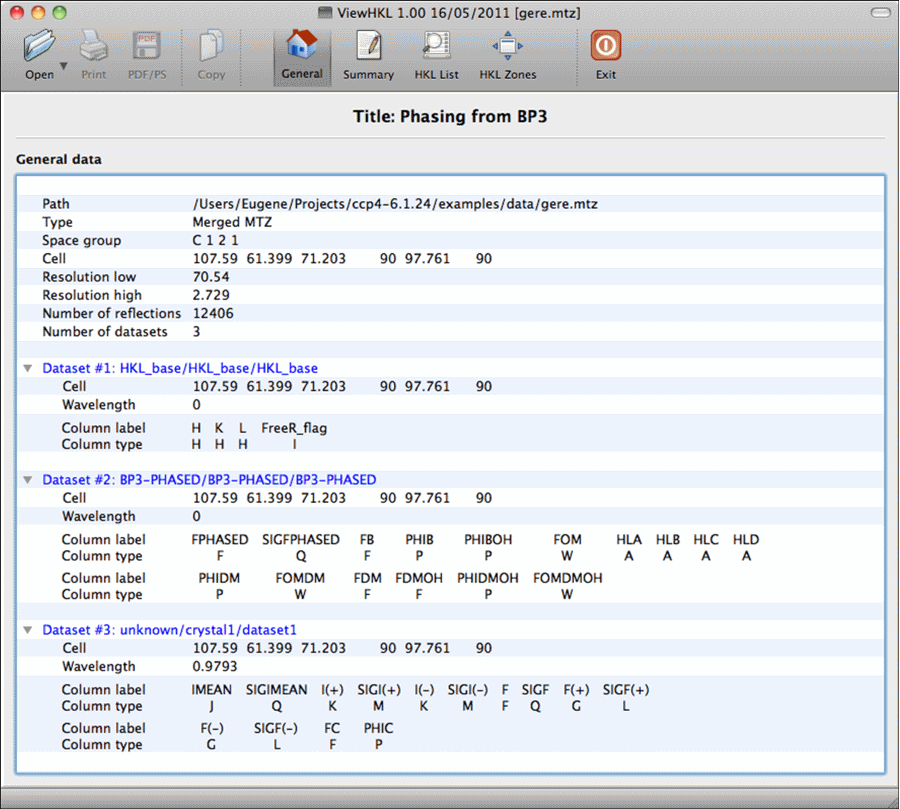
Figure 1. General outlook of VIEWHKL. The General tab presents basic header information from reflection file, and opens automatically while the file is being loaded
The reflection data browser (HKL List tab, Figure 3) allows for visual inspection of raw data and searches for individual reflections. Columns are grouped by column type, same as in the Summary tab (Fig. 2), and presented in alternating colours for easier perception. Due to the large number of reflections (O(106)), putting all of them into one table is not optimal for performance considerations. Therefore, the browser presents data in sliding “windows”, the position and size (the number of reflections) of which is chosen with two horizontal sliders at the bottom of the page. In order to look for a particular reflection, the user needs to put h,k,l indices into the corresponding input fields provided in the bottom of the page, and press Enter; the page will automatically update such that the reflection (or, if such reflection is not found, the one with closest h,k,l) is displayed in the first row.
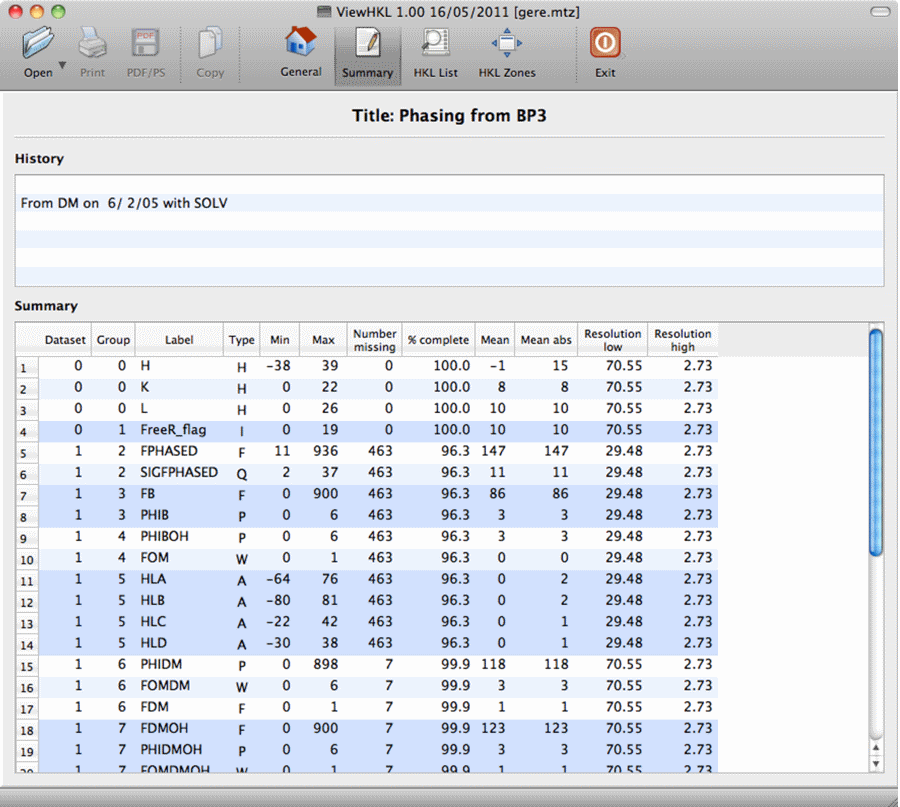
Figure 2. Summary tab presents history records and extended data set summary.
The fourth tab, HKL Zones (Figure 4), provides graphical representation of reflection data. In order to represent 3D data on the screen, the h, k, l sphere is sliced into planes (or “zones”) according to the equation
![]()
where {H,K,L} is the plane’s normal and N is an offset from the origin (“Zone level”). The display in the left-hand side of the page shows reflections that are found in the zone, as well as the plane axes corresponding to the particular choice of {H,K,L}. Reflections are shown as round spots, whose size and intensity indicate the reflection’s amplitude or intensity (as chosen by the corresponding radio buttons in the right-hand side toolbar).
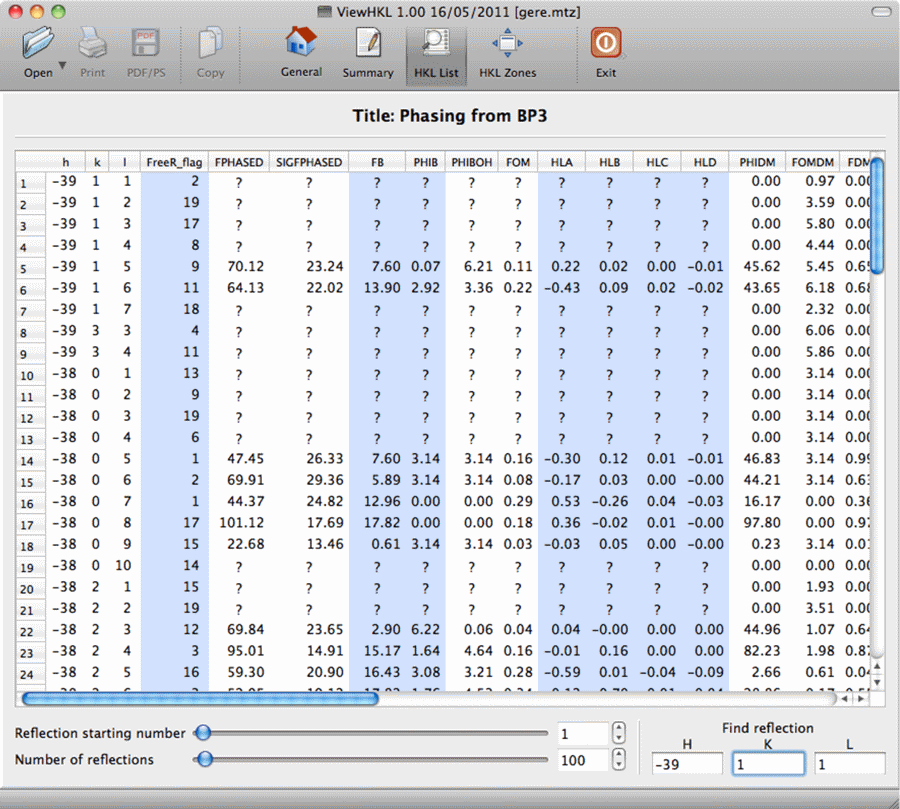
Figure 3. HKL List tab provides hkl data browser and reflection data search function.
The uppermost control in the right-hand side toolbar (see Fig. 4) provides the choice of reflection data (group of columns) to be displayed in the page. Three fixable buttons allows for a quick switch between the “most popular” zones: hk0 (i.e. H=K=0, L=1), h0l and 0kl. Each choice of {HKL} is indicated in “Zone normal” input fields. Using these fields, a user may visualize a zone with arbitrary {HKL}.
The next four controls in the toolbar are for the choice of zone level N, the resolution limit for display and, independently, for the green circle in it (which can be switched on/off using the corresponding radio button), and for the display’s zoom. Reset buttons on the right from these controls assign default values for them. The resolution circle in the screen may be adjusted directly with the mouse (grab-and-drag), which is synchronized with the displayed value in the corresponding control.
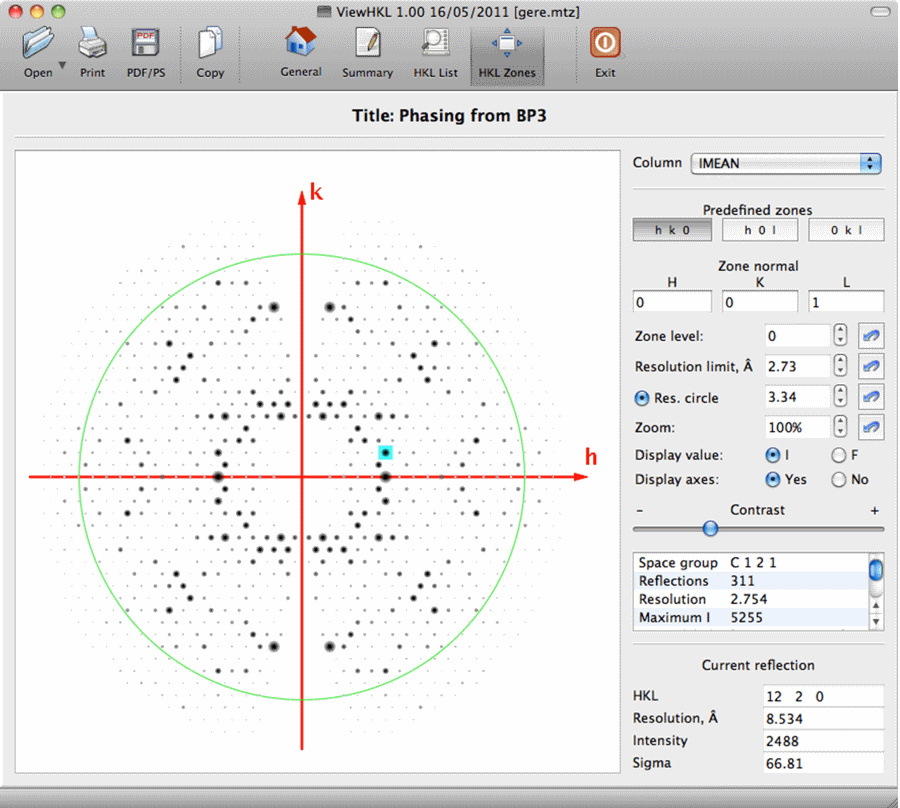
Figure 4. HKL Zones tab provides graphical representation of reflection data.
The next control element, the contrast slider, allows a user to adjust the enhancement of strong reflections to their personal taste and in dependence of particular data, in order to make the identification of the reflection pattern easier. This may also be helped sometimes by choosing amplitude, rather than intensity, for the representation of reflections in the display. The corresponding choice is provided by two radio buttons above the contrast slider.
Below the contrast slider, the right-hand side toolbar shows some basic data for the chosen zone (space group, number of reflections, resolution and intensity/amplitude limits, and cell parameters). Hovering the mouse over reflection spots in the display is accompanied by the indication of reflection parameters ({h,k,l}, resolution, intensity and sigma) in the bottom part of the toolbar, with the highlighting of the corresponding reflection in the display area (cf. Fig.4).
Starting from CCP4 version 6.3.0, VIEWHKL supersedes MTZDUMP as the default application for the inspection of MTZ files in the CCP4 GUI, and will be integrated with the next-generation GUI-2, which is currently under development.
This article may be freely cited and referenced.
Acknowledgement
The authors are grateful to members of CCP4 Working Group 2 and many CCP4 developers and users, who tested VIEWHKL and gave a constructive feedback, which helped debugging and design.
References
[1] A.A.Vaguine, J.Richelle, S.J.Wodak. SFCHECK: a unified set of procedure for evaluating the quality of macromolecular structure-factor data and their agreement with atomic model. Acta Cryst.(1999). D55, 191-205
[2] http://www.ccp4.ac.uk/html/ctruncate.html
[3] P.R.Evans, Scaling and assessment of data quality, Acta Cryst. D62, 72-82 (2006)
[4] http://www.ccp4.ac.uk/dist/html/wilson.html
[5] http://www.ccp4.ac.uk/dist/html/mtzdump.html
[6] http://www.ccp4.ac.uk/dist/html/hklplot.html
[7] http://www.ccp4.ac.uk/dist/html/hklview.html
[8] Cowtan K. (2003) IUCr Computing Commission Newsletter, 2, The Clipper C++ libraries for X-ray crystallography, 4-9