Fig. 1. Schematic presentation of the search for a persistent signal. The answer corresponds to the peak presented in all search functions (green circles) and not to any of the highest peaks in individual functions (red circles).
Andreas Bühler1, Vladimir Y. Lunin2 and Alexandre
Urzhumtsev1
1Physics Department, Nancy-University, 54506 Vandoeuvre-les-Nancy,
France
2Institute of Mathematical Problems of Biology, Russian Academy of
Sciences, 142290 Pushchino, Moscow Region, Russia
1Departement of Structural Biology, IGBMC,CNRS-INSERM-ULP, 1 rue
L.Fries, 67404 Illkirch, France
Simultaneous use of multiple translation functions may solve the phase problem even when individual translation functions fail to identify the solution by the conventional molecular replacement procedure.
Molecular replacement, translation function, persistent solution, cluster analysis, phasing
Molecular replacement is a very attractive tool for structure determination because it uses a single experimental data set and also because it gives immediately a starting model, or at least its major part. The method is based on the idea that the search model is sufficiently similar to the molecule under study so that positioned correctly it reproduces the best possible experimental structure factor magnitudes. Therefore, the optimal position of the model can be recognised by this feature. Unfortunately, this hypothesis fails and the method does not work when the model is too incomplete or too different from the structure under study. Recently, several new approaches have been suggested, either varying automatically the model with a hope to find a better one or taking into account this imperfection of the current model. Alternatively, the whole strategy of the search of a single extremum (usually, the global one) of a single target can be revised. Previously, advantages of a simultaneous analysis of several rotation functions for solution of difficult molecular replacement cases have been demonstrated. This article suggests the next step in this procedure. Knowing approximate orientations of an imperfect atomic model (or several models), one may obtain a starting image of the electron density when the conventional translation search fails to recognise a single optimal position of the search model.
Crystallographic literature always considers the molecular replacement method (Rossmann & Arnold, 2001, as a review for the method) as a method to solve the phase problem. In fact, one of features of this technique is that it gives not only the phase set but also an approximate atomic model which simplifies further structure determination. This requires the identification of the unique position of the search model. The main hypothesis of the molecular replacement is that at this optimal position the model structure factor magnitudes correspond to the experimental values as good as possible. The phases of the structure factors calculated from such an optimally positioned model may be used to calculate Fourier syntheses, to correct and complete the model accordingly and to refine it after all. The search for the best fit may be done either by simultaneous rotation and translation the model(s) (for example, Kissinger et al., 1999; Glycos & Kokkinidis, 2000) or by execution these two steps one after another to gain computing time as it is implemented in most of molecular replacement packages.
When the search model differs significantly from the structure under study, there is no reason to believe that for its optimal position the best match of computed and observed structure factors is achieved. On the contrary, the presence of such irremovable model errors (Lunin et al., 2002) may lead to an incorrect model position. Traditionally, in such a situation crystallographers vary the model or/and the target (for example, resolution of the data set, integration radius etc.). A great step in molecular replacement was done by introducing maximum-likelihood targets (Read, 2001; Storoni, 2004) that can statistically take into account the model imperfections, namely incompleteness and mean discrepancy. A new and more appropriate model can be obtained automatically by model modification (for example, Suhre & Sanejouand, 2004) or model building (Keegan & Winn, 2007).
Alternatively, one may change completely the search strategy. We still suppose that the search model, although being imperfect, is somehow relevant to the structure. It contains some structural information and in its optimal position it reproduces crystal structure factors reasonably well but not necessarily with the best magnitude correspondence. This means that a molecular replacement target has a peak at this position even when this peak is not the highest one. Of course, the target may have a number of spurious peaks. When we update the model or modify the target, the peak for the correct position usually stays whereas spurious peaks may appear or disappear. Therefore, we do not look anymore for the global extrema of targets knowing that they may correspond to a wrong position. Instead, we are looking for the most persistent peak that, following this logic, stands for the solution of the molecular replacement problem (Fig. 1). Making several searches, as expected, increases the information available and simultaneous analysis of multiple searches may allow to identify the solution non visible in a single search.
Study of multiple rotation functions (Urzhumtsev & Urzhumtseva, 2002) confirmed that the correct model orientation in difficult cases can be identified using this principle. The current article extends this principle to the next step of molecular replacement, the translation search, leading to the final solution. The presented technique is based on the simultaneous use of results of multiple searches. In what follows for simplicity we consider the molecular replacement search with a single body.
Fig. 1. Schematic presentation of the search for a persistent signal. The answer corresponds to the peak presented in all search functions (green circles) and not to any of the highest peaks in individual functions (red circles).
To search for a persistent signal, one needs to define the closeness of two peaks of the target. A conventional measure as the root-mean-square (rms) is not a good choice for translation searches. First, when the search model is significantly different from the structure under study, the exact orientation and position have no strict meaning. In slightly different orientations obtained after rotation analysis, a search model may have a good superposition with the answer by one or another part. For this reason, with slightly different rotation peaks, the translation search may give different positions with a large rms discrepancy between them. Second, it is even more difficult to compare the position of different models used in the same molecular replacement project. Third, different positions of imperfect models may correspond to equally good solutions equivalent in terms of electron density. For example, a b-sheet composed of n more or less equal strands may be roughly well superimposed in different ways with a larger (n+1 strands) or shorter (n-1 strands) b-sheet in the crystal. Similarly, a helical model may be reasonably well superimposed with the structure being simultaneously rotated and translated accordingly to the pseudo-helical symmetry.
In fact, molecular replacement targets do not fit the model to the structure atom by atom but compare the magnitudes of the Fourier coefficients of the density generated from the model with the corresponding experimental values. An example is the magnitude correlation

where t is the translation vector of the of the model initially positioned at the origin. An early substitution of the atomic model by the Fourier coefficients of its density is one of the major advantages of molecular replacement packaged starting from AMoRe (Navaza, 1994).
If we agree that the search model(s) is (are) significantly different from the structure under study, we may decide to use only a part of the information obtained from molecular replacement, namely the phases of structure factors. Like in experimental phasing methods, these phases will be used in model building by the electron density maps interpretation. We do not search any more for the atomic positions while of course the search models may be always used as a guide.
Comparison of two peaks of the translation search, done with different search models each in its own orientation, may be done by comparison of the phases calculated from the corresponding models. An example is the weighted phase correlation (Lunin & Woolfson, 1993)

It corresponds to the correlation of two Fourier syntheses both calculated with
the experimental structure factor magnitudes but with two different phase sets,
 and
and  ,
respectively. In fact, to cope with the problem of a different possible choice
of the origin of the unit cell (Lunin & Lunina, 1996) a modified expression
should be used where u stands for all possible choices of the origin for
the given space group
,
respectively. In fact, to cope with the problem of a different possible choice
of the origin of the unit cell (Lunin & Lunina, 1996) a modified expression
should be used where u stands for all possible choices of the origin for
the given space group

Eventually, several possible strategies may be investigated. In a simplest one, the search models are positioned randomly (both orientation and translation) in the unit cell. For each model structure factors are calculated and the phase sets are selected if the magnitude correlation is high enough. As an option, only the model orientation is chosen randomly (or generated systematically in a grid) followed by a fast translation search from which the peaks are selected. Both variants of this strategy are similar to FAM searches (Lunin et al., 1995, 1998) but use much more information about the structure. After having selected a (large) number of phase sets, their mutual closeness is studied by cluster analysis procedures (for example, see Lunin et al., 1990, 1995). Then the average phase values and corresponding figures of merit for the largest cluster are computed and used to calculate the Fourier syntheses. This approach may require a lot of computer time to accumulate enough of good combinations of model orientation and position.
In the second strategy the rotation search precedes the translation search. First, multiple rotation function analysis suggests a cluster of model orientations (several models in several similar orientations). This requires a preliminary orientation alignment of the search models. Then, the translation searches are done only with the models from this orientation cluster. Here an obvious gain in CPU time is compensated by a risk of choosing a wrong orientation cluster. Eventually, one may try to invert this procedure and to solve first the translation problem and only then to search for the model orientation.
In the current project, we had no possibility to check various strategies and some results of only consecutive rotation-translation searches are shown below.
Corn Hageman factor inhibitor (CHFI) previously has been shown as one of the difficult molecular replacement cases (Chen et al., 2000). The protein crystallises in space group P42212 with the unit cell parameters a = b = 57.12 Ĺ, c = 80.24 Ĺ. Twenty NMR models (Strobl et al., 1995, PDB code 1bip) were used for the molecular replacement search. They are reasonably similar to the final model (Fig. 2) obtained by Behnke et al. (1998, PDB code 1bea). However, the difference was enough to make the molecular replacement solution very difficult with conventional tools.
For the final model, structure factors have been calculated and their phases were used to compare with the phases obtained from the search models.
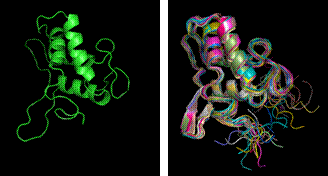
Fig. 2. Ribbon view of the CHFI final structure (left) and superimposed twenty NMR models (right) used for molecular replacement searches
Previously, Urzhumtsev & Urzhumtseva (2002) used this data set for studies with multiple rotation functions. None of AMoRe individual rotation function, calculated with each of twenty NMR models at various resolutions, gave a signal allowing to interpret it as the peak for the correct model orientation. Then the peaks for twenty rotation functions calculated at the resolution 4-10 Ĺ were studied together. Provided that some angle-distance cut-off k is chosen, the total set of peaks may be split into a number of clusters. Inside a cluster, the models oriented accordingly to their peaks, may be superimposed to each other by a rotation of less than k degrees. On the contrary, this is impossible for models from different clusters (Urzhumtseva & Urzhumtsev, 2002).
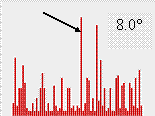
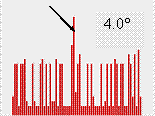
The authors expected that the peak for the correct orientation exists for most of rotation functions and therefore should belong to the largest cluster of orientations. Indeed, it was the case when the cut-off varied in quite large reasonable limits (Fig. 3).
For the set of rotation functions calculated with the diffraction data at 5-10 Ĺ resolution, the correct orientation also belonged to the largest cluster when the cut-off level was 6.5° and became slightly smaller when the cut-off changed (not shown here).
 |
 |
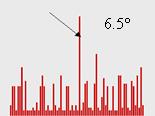 |
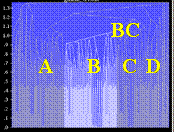
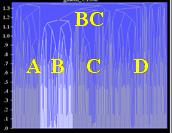
Fig. 3. Size of clusters of close model orientations corresponding to highest peaks of twenty rotation functions calculated with NMR models of CHFI at the resolution 4-10 Ĺ. The three images shown correspond to a different choice of the angular cut-off level. For all three cases the correct model orientation belongs to the largest cluster indicated by arrow.
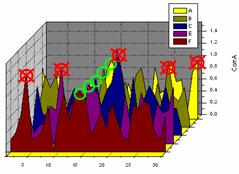
First translation tests were done with the exact model taken in its approximately correct orientation; an artificial rotation error of only 2° was introduced. At a conventional resolution of 5-15 Ĺ, the translation function calculated with AMoRe had a peak with the magnitude correlation 0.85 versus 0.76-0.80 for a large group of next peaks. This characteristic unambiguously identifies the peak as the solution. The phases calculated from the model positioned accordingly have the weighted phase correlation of 0.84 with the phases from the correct solution, which is much larger than the correlation for a phase set calculated from the model positioned in any other peak. Fig. 4 shows the results of this search in the form of a two-dimensional distribution of points. For the model positioned accordingly to each peak of the translation function its structure factors are calculated. The correlation of their magnitudes with the experimental magnitudes and the correlation of their phases with the phases from the exact solution are used as coordinates of the point in the diagram. The correct solution is clearly distinguished by its horizontal coordinate (the criterion to choose the solution) and gives much better phases (a very large gap along the vertical axis).
The same calculations were repeated for the exact model but with a significant error in its orientation, namely 10°. Now the translation function, calculated as the correlation of magnitudes, has a number of peaks of a similar height without a significant gap between the highest one and the next one. More important, this highest peak does not correspond to the position with the highest correlation of phases. The latter is hidden in the bulk of other peaks and cannot be distinguished by CorrA. Moreover, even when we can identify this ‘best’ peak, the corresponding phases are quite wrong with a very low correlation CorrP, only about 0.20.
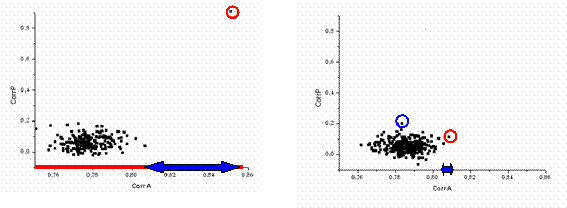
Fig. 4. Results of the translation function search with the exact model for CHFI at the resolution 5-15 Ĺ. Each point corresponds to a model positioned accordingly; coordinates of the point are the correlations of the magnitudes (horizontal axis) and phases (vertical axis) of the calculated structure factors with the experimental magnitudes and the phases calculated from the exact solution. Left image shows the results for the model in a relatively correct orientation (orientation error 2°). Right image shows the results for the model with a significant error in its orientation (10°). Red circle indicates the model with the higher correlation of the magnitudes. In the right image it is different from the model with the best phase values (blue circle) that cannot be identified by its magnitude correlation among other models.
Accordingly to the main idea, we took all twenty NMR models together and calculated for each of them the standard AMoRe translation function (Navaza & Vernoslova, 1995) at the resolution of 5-15 Ĺ. As previously for the study case with the known answer, magnitude and phase correlations have been calculated for each position of the model and the results of each search were presented in the form of the two-dimensional distribution (CorrA, CorrP). For each test, peaks from all translation functions were taken together, about 300 highest of them were selected and analysed. The three tests presented below differ in accuracy of model orientations.
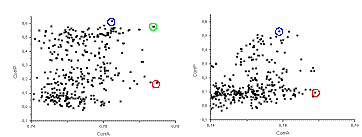
In the first test, all NMR models were taken in the optimal orientation, obtained from their best superposition with the refined structure. Even in this idealised case the highest peak (magnitude correlation near 0.775) indicates a wrong solution with the phase correlation near 0.2 (Fig. 5, left). However, the second solution, in the decreasing order of CorrA, has a quite good phase correlation close to 0.60. The best solution, in terms of phases, has a magnitude correlation CorrA = 0.76 and is ‘hidden’ among tens of other solutions. In general, this behaviour completely reminds the behaviour of FAM models (Lunin et al., 1995).
Then two other scenarios were tried, based on orientations of the search models selected from the peaks of twenty rotation functions. In the second test, the models were taken in the orientations from the best cluster obtained by the multiple rotation function at the resolution 5-10 Ĺ with the cut-off level 6.5°. In the third test they were taken in the orientations determined from the largest cluster of the multiple rotation function calculated at the resolution 4-10 Ĺ when the cut-off level is equal to 4.0°. For both tests the highest peak in all rotation functions had CorrA = 0.77, was practically indistinguishable in height from the next peaks and obviously corresponded to a wrong model position (Fig. 5, centre and right). The corresponding phase correlation is 0.1 and 0.3, respectively. For less precise set of orientations (second test), the highest phase correlation was near 0.50; for more precise orientations obtained after rotation searches at 4-10 Ĺ (third test) it was slightly better, 0.55 (Fig. 5, right). However, in both tests the best model (in terms of phase correlation) is hidden among tens of other peaks with the CorrA near 0.76 and therefore cannot be identified without knowing the answer. (One may imagine that all these points are projected on the horizontal axis and we need to identify the correct solution knowing only this projection).
 |
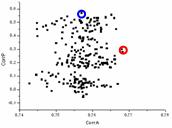 |
Fig. 5. Results of the translation search for CHFI at the resolution 5-15 Ĺ with twenty NMR models. Each point corresponds to a peak of the translation function. For the model positioned accordingly to each peak a set of structure factors was calculated. Correlation CorrA of their magnitudes with the experimental data and the correlation CorrP of their phases with those calculated from the exact model are the point coordinates (horizontal and vertical axes, respectively). Red circle indicates the highest peak, the blue one indicates the peak resulting in the best phases. (Left) Search models are in their optimal orientations. (Centre) Orientations chosen from the peaks of 20 rotations functions; 5-10 Ĺ resolution, 6.5° cluster cut-off. (Right) Orientations chosen from the peaks of 20 rotations functions; 4-10 Ĺ resolution, 4.0° cluster cut-off.
In order to identify the signal persistent in the ensemble of the translation functions, the obtained phase sets have been analysed by a clustering procedure (see for example Lunin et al., 1990, 1995) for each of the three tests. Fig. 6 shows corresponding cluster trees. Phase sets are shown by points at the horizontal axis. The points are joined (corresponding phase sets are merged) at the height proportional to the ‘distance’ between the phase sets. Each of the trees is clearly split in a number of clusters indicated by letters. The larger is cluster, the more models are contained. The lower the cluster in the tree, the more compact it is, and the closer are the model phases composing this cluster. According to the initial hypothesis, the cluster for the best phase set, corresponding to the group of models giving the persistent signal, should be the low and large one. Indeed, in all three cluster trees such a cluster can be identified (selected in white) and it corresponds actually to the best phase set (Table 1). The mean figure of merit is the measure of the dispersion of the phase values in the cluster around their average. We remind that the number of phase sets in each cluster and its mean figure of merit are obtained directly from calculated phase sets and that they can be used to select the cluster. On the contrary, the phase correlation CorrP is available only for known structures.
For the exactly oriented models the cluster for the correct solution (cluster B) is very different from other clusters by its size and compactness. Interestingly, the mean phase correlation is larger than for any individual phase set belonging to it. The mean figure of merit above 0.5 suggests usefulness of these phases (Lunin & Woolfson, 1993).
If the choice between a few clusters is not clear, a larger cluster including all of them can be taken. Table 1 shows that in this case the mean phase correlation does not decrease drastically however this reduces the mean figure of merit calculated for each reflection. Finally, all selected phase sets can be averaged together. Table 1 shows that even in this case the mean phase values are good enough. In other words, the phases from wrong positions are distributed more or less uniformly in comparison with the phases from the correct cluster. Nevertheless, the overall figure of merit becomes unreasonably low and does not assure the quality of selected phases.
For the models oriented approximately, the cluster tree (Fig. 6, centre) still distinguishes one cluster that is more compact then others (also cluster B). Its vertex is higher than it is in the previous test showing a larger dispersion of the models inside it. Even if this cluster is larger than cluster C, the corresponding figure of merit is higher than that for C and the choice could be done for this cluster. In case of doubt, B and C can be considered together which again does not decrease phase correlation but does decrease the mean figure of merit.
 |
 |
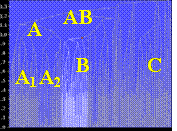 |
Fig. 6. Cluster trees for the phase sets obtained after multiple translation function analysis with the twenty NMR models of CHFI. (Left) Models in the optimal orientations obtained from their superposition with the final model. (Centre) Models in approximate orientations obtained from the multiple rotation function analysis at 5-10 Ĺ and the cluster selected with the cut-off 6.5°. (Right) Models in more precise orientations obtained from the multiple rotation function analysis at 4-10 Ĺ and the cluster selected with the cut-off 4.0°. Letters indicate individual clusters of their groups referred in Table 1 and in text.
Table 1. Characteristics of the principal clusters of the cluster trees shown in Fig. 6.
|
test |
Cluster |
A |
B |
C |
D |
AB |
BC |
all |
1 : ideal |
Nvariants |
61 |
106 |
57 |
26 |
- |
163 |
312 |
orientation |
CorrP |
0.33 |
0.67 |
0.38 |
0.15 |
- |
0.64 |
0.60 |
|
<fom> |
0.53 |
0.57 |
0.53 |
0.54 |
- |
0.49 |
0.31 |
2 : imprecise |
Nvariants |
56 |
65 |
50 |
61 |
- |
120 |
308 |
orientation |
CorrP |
0.08 |
0.55 |
0.30 |
0.13 |
- |
0.52 |
0.51 |
|
<fom> |
0.32 |
0.49 |
0.47 |
0.35 |
- |
0.35 |
0.17 |
3 : good |
Nvariants |
74 |
61 |
33 |
- |
179 |
- |
273 |
orientation |
CorrP |
0.33 |
0.62 |
0.05 |
- |
0.33 |
- |
0.52 |
|
<fom> |
0.56 |
0.61 |
0.61 |
- |
0.56 |
- |
0.29 |
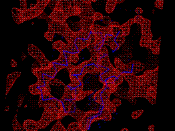
In the intermediate case of imprecise model orientations but with a smaller error (Fig. 6, right) there is a cluster low in the tree and therefore compact in phase space (again, cluster B). It is lower than the cluster B in the previous case indicating that its phase sets are closer to each other. Different to the first test with the optimally oriented models where the choice is unambiguous, the cluster A may be considered as an alternative candidate with a slightly larger number of sets. However, in fact the cluster A is composed of two subclusters of a smaller size, A1 and A2, each of them smaller than B. The mean figure of merit for B is larger than that for A, suggesting that B is the correct choice. As a final check the maps calculated with these two phase sets are analysed. They are quite different in quality. The map calculated at 5 Ĺ resolution with the phases from the cluster B (Fig. 7, left) shows continuous density where a-helices are clearly seen. In the equivalent map with the phases from the cluster A the density is seen as a set of isolated blobs and can be hardly interpretable (Fig. 7, centre).
To complete the study, one more test with the multiple translation function has been done with the models in the orientations from the alternative, wrong cluster obtained for the rotation functions at resolution of 5-10 Ĺ. The corresponding cluster tree for the multiple translation function shows a number of clusters, more or less of the same size and compactness, none of them are large and compact enough to fulfil the presented conditions (Fig. 7, right). Such a tree, since it does not show a persistent signal, may serve as an indicator of a probably wrong choice of the set of model orientations.
 |
 |
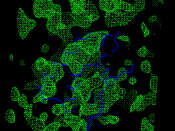 |
Fig. 7. (Left) 5 Ĺ-resolution Fourier map calculated with experimental structure factor magnitudes and phases from the cluster B (Fig.6, right). A main chain of the correct model is superimposed. (Centre) A similar image, the map is calculated with the phases from the cluster A. (Right) Cluster tree for the multiple translation search with the models from a wrong orientation cluster.
When the search models in molecular replacement studies are insufficiently similar to the structure under study, the input information is weak. As a consequence one may fail to find strong information in the answer, namely a single position for one of these models. In such difficult cases we suggest to search for an answer in a weaker form, only as phases of structure factors and corresponding Fourier syntheses. These maps will be used then to build a model as for any other phasing methods.
The current tests show that a simultaneous use of several sources of information, namely several translation functions, may amplify the information and find the answer in the situation when none of individual translation functions does. While in practice the persistence of signal is an important feature to check the answer, it is not used directly as a target. The new approach is based on the persistence and does not result in a single model positioned in the unit cell. This changes completely the traditional way of a search for the answer as a single set of model parameters (rotation and translation) corresponding to the global maximum (minimum) of a single target.
The first tests with the multiple translation function reported here illustrate the potential of this approach and open a number of questions to be addressed in the future.
First, the best strategy should be established. The question is whether to do a simultaneous search for the model orientation and translation or to separate them. The current procedure can be applied in the same way in both cases, but with different drawbacks. Determining in advance an approximate model orientation saves CPU-time but increases the risk of missing the solution due to a wrong set of model orientations, whereas the simultaneous variation of orientations and translations is much safer but considerably time-consuming. Probably the preference for one or another strategy depends on the practical situation.
Second, the question is how one may extract maximal information from such searches. When the searches are done at a given resolution, the phases can be calculated from the models and then clustered at a different resolution, eventually at a higher one. This can increase the amount of information in the maps.
One more question is the performance of this approach when the crystal structure is composed of several domains and especially when these domains are somehow similar (or when the structure has an internal symmetry). Here the translation function ‘in half of trials’ may put the search model at the place of one domain, and ‘in the second half of trials’ at the place of another one. Probably operating at the level of phases and their similarity may simplify the solution for such crystals.
To make this approach a routine procedure, special software should be developed both for clustering analysis and for merging it with the molecular replacement packages.
AB participated in this project in the frame of his M2 stage of the ‘cursus intégré’ of the universities of Nancy (France), Saarbrücken (Germany) and Luxembourg. VYL and AU were supported by grant RFBR 05-01-22002_CNRS. The authors thank Markus Sander for his participation at the initial stage of this project, Natalia Lunina for an access to the programs from the FAM phasing suite and Pavel Afonine for critical reading of the manuscript. PyMOL (DeLano,2002) was used to display and analyse the maps.
Behnke, C.A., Yee, V.C., Le Trong, I.,Pedersen, L.C., Stenkamp, R.E., Kim,
S.-S., Reeck, G.R.& Teller, D.C. (1998).Biochemistry, 37,15277-15288.
Chen, Y.W., Dodson, E.J. & Kleywegt, G.J. (2000). Structure, 8, R214-R220.
DeLano, W.L. (2002). The PyMOL Molecular Graphics System, DeLano Scientific, San Carlos, CA, USA. http://www.pymol.org
Keegan, R.M. & Winn, M.D. (2007). Acta Cryst., D63, 447-457.
Kissinger, C.R., Gehlhaar, D.K. & Fogel, G.B. (1999). Acta Cryst., D55, 484-491.
Glykos, N.M. & Kokkinidis, M.. (2000). Acta Cryst., D56, 169-174.
Lunin, V.Yu., Urzhumtsev, A.G. & Skovoroda, T.P. (1990). Acta Cryst. A46, 540-544.
Lunin, V.Y. & Wolfson, M.M. (1993). Acta Cryst. D49, 530-533.
Lunin, V.Yu., Lunina, N.L., Petrova, T.E., Vernoslova, E.A., Urzhumtsev, A.G. & Podjarny, A.D. (1995). Acta Cryst. D51, 896-903.
Lunin, V.Y. & Lunina, N.L. (1996). Acta Cryst. A52, 365-368.
Lunin, V.Y., Lunina, N.L., Petrova, T.E., Urzhumtsev, A.G. & Podjarny, A.D. (1998). Acta Cryst. D53, 726-734.
Lunin, V.Y., Afonine, P.V. & Urzhumtsev, A. (2002). Acta Cryst. A58, 270-282.
Navaza, J. (1994). Acta Cryst., A50, 157-163
Navaza, J. & Vernoslova, E.A. (1995). Acta Cryst., A51, 445-449.
Read, R. (2001). Acta Cryst., D57, 1373-1382.
Rossmann, M.G. & Arnold, E. (2001). International Tables for Crystallography, Vol. F., Kluwer, Dordrecht-Boston-London, pp.263-292.
Strobl, S., Muhlhahn, P., Bernstein, R., Wiltscheck, R., Maskos, K., Wenderlich, M., Huber, R., Glockshuber, R. & Holak, T.A. (1995). Biochemistry, 34, 8281-8293.
Storoni, L.C., McCoy, A.J. & Read, R.J. (2004). Acta Cryst., D60, 432-438.
Suhre, K. & Sanejouand, Y.-H. (2004). Acta Cryst., D60, 796-799.
Urzhumtsev, A. & Urzhumtseva, L. (2002). Acta Cryst., D58, 2066-2075.
Urzhumtseva, L. & Urzhumtsev, A. (2002). J. Appl. Cryst., 35, 644-647.