Figure
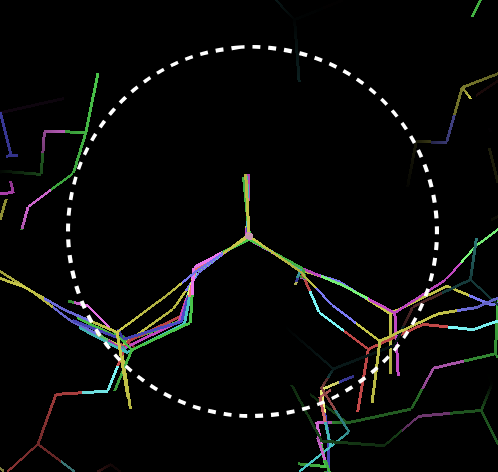
1: Superimposed Ca positions from a known reference structure.
Kevin Cowtan
York Structural Biology Laboratory, University of York, York YO10 5YW, UK
"Buccaneer" is a new software tool to trace protein structures in electron density maps by identifying connected alpha-carbon positions using a likelihood-based density target. At this stage it does not do refinement or rebuilding. Until these are implemented it will not be directly comparable to existing automated model building packages. However, it is quite fast, and can work at low resolutions given good phases.
The underlying principle of "Buccaneer" is the repeated application of an electron density likelihood function to identify probable oriented Ca positions in a noisy electron density map. The same likelihood is applied in several ways: to find candidate positions, using a six dimensional search, to grow a chain by adding new residues either side of an existing Ca position, and to refine Ca positions.
The density likelihood function is used to recognise characteristic features corresponding to a Ca position in a sphere of density whose radius is 4.0Ĺ. This approach is related to that of CAPRA (Ioerger and Sacchettini, 2002), however in this case oriented electron density features are used. The density at a candidate position and orientation are scored in terms of a target function based on the mean electron density averaged over many Ca positions in an electron density map from a known structure. However, the score is also weighted according to how conserved the density is at any position relative to the Ca in the known structure, with strongly conserved density given a high weight (i.e. it must match the target density well), and poorly conserved density a low weight (i.e. it doesn't matter whether it matches). This information is combined in a likelihood function using the method of Cowtan (2001).
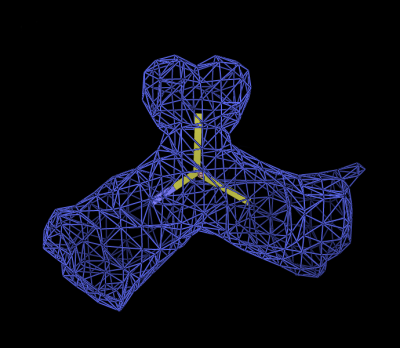
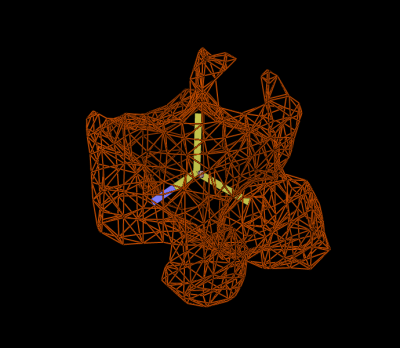
The likelihood function can therefore be described in terms of an expected density and a weighting. These are visualised in figures 1-3. Figure 1 shows a set of superimposed Ca positions from a known reference structure, along with the 4.0Ĺ sphere of interest. Figure 2 shows the mean density corresponding to those atoms, and Figure 3 the variance density, contoured to highlight the most conserved regions. Note that the most conserved regions are not necessarily those of highest density: regions of low density can also provide important information in locating Ca positions.
Figure
1: Superimposed Ca positions from a known reference structure.
Figure
2: Mean density calculated over many Ca groups.
Figure
3: Variance density calculated over many Ca groups.
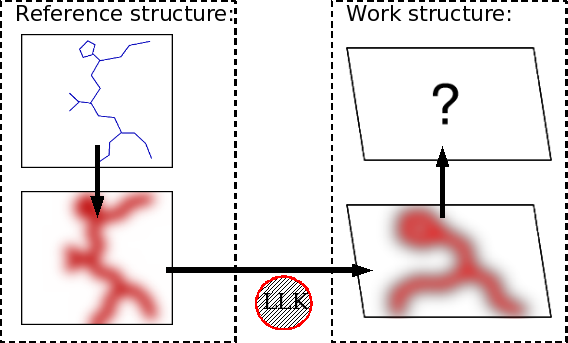
It is important that the search target function should represent the features to be identified in the target electron density map as well as possible. As a result, the electron density target function is generated from scratch for every calculation. A known, reference structure, for which an atomic model is available, is used. A simulation process is used to create an electron density map for the reference map whose features match the target map as well as possible. The resolution, the atomic motion, and the noise level in the reference map must therefore be comparable to those of the target map to be solved. This simulation process involves a number of scaling steps, and addition of a noise term to the reference data based on the figures-of-merit of the target data. The calculation is therefore dependent on realistic error estimates (i.e. figures-of-merit) being available for the structure to be solved.
Since the electron density features corresponding to a Ca position in the simulated reference map are known, these may therefore be used to identify probable Ca positions in the target map. This inference is illustrated in Figure 4.
Figure
4: Inference of Ca in the work map based on features of the reference
map.
Candidate Ca positions are located by searching the electron density. A 6-dimensional position and orientation search are conducted using FFTs to perform the positional search, using the "fffear" approach (Cowtan, 1998).
The candidate Cas are grown by adding residues at either end, in accordance with the restraint that the new resulting Ramachandran angles must be plausible. A two-residue look-ahead approach is used to add each new residue, in a manner similar to the approach of Terwilliger (2002).
Overlapping fragments are joined to make longer chains. This can lead to branches in the chain. In this case, the chain is routed in such a way to produce the longest connected chain, in a manner similar to Cohen et al (2004). Note that there will also be chain fragments which cannot be joined, for example forward and backward traces of the same chain segment.
Likelihood comparison between the density of each residue in the work structure and the residues of the reference structure allows sequence to be assigned to longer fragments.
Clashing fragments are examined and the shorter fragment, or the unsequenced fragment is pruned to eliminate the clash.
The carboynl oxygens, and side chain atoms for any sequenced residues, are added.
The method has been implemented in a
software package, "buccaneer", which may be obtained by download from
Application to a real structure at
3.0\Aring; using experimental phasing data from the
The software has been tested on 58 test structures, and has been found to be useful over a wide range of resolutions down to 3.6Ĺ. However in its current form it is dependent on good starting phases from phase improvement.
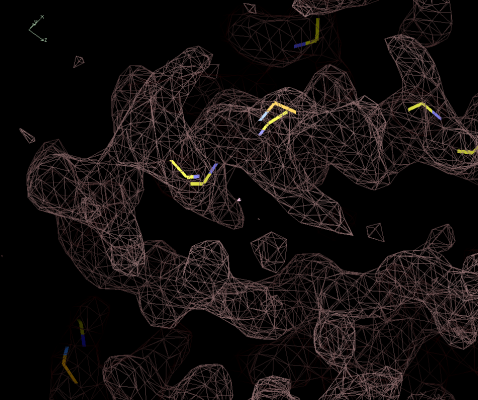
Figure 5:
Initial Ca positions from finding. Of the 5 shown, 3 are correct and 2
incorrect.
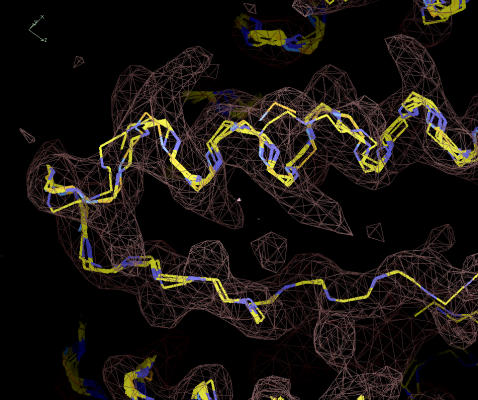
Figure 6:
Chain fragments after growing. The same segment is traced multiple
times.
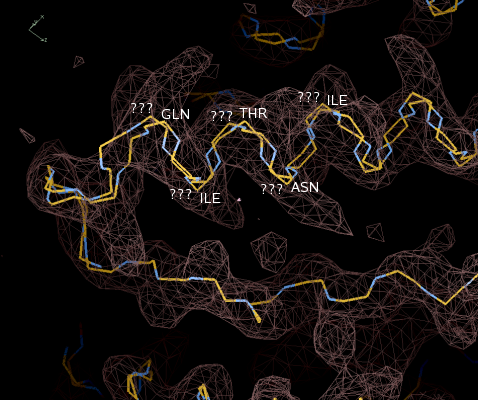
Figure 7: Joined
fragments. Note one helix has been traced in both directions.
The sequencing step has also been performed, and some
residues labeled.
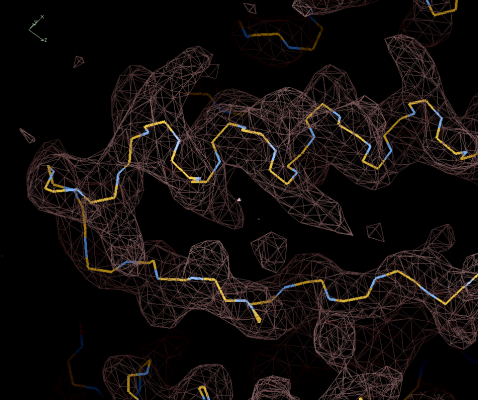
Figure 8: Pruned
model. The reversed fragment has been removed
on
the grounds that it was not sequenced. (It is also shorter.)
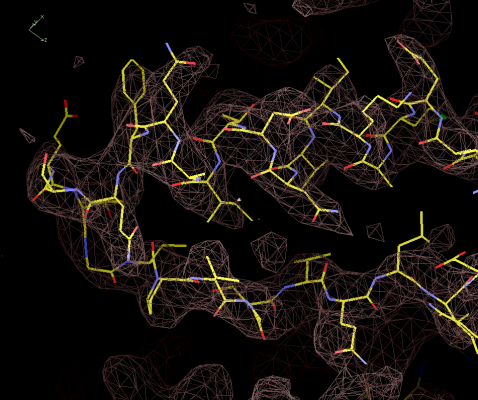
Figure 9:
Model after rebuilding, with the side-chain and carboynl oxygens
added.
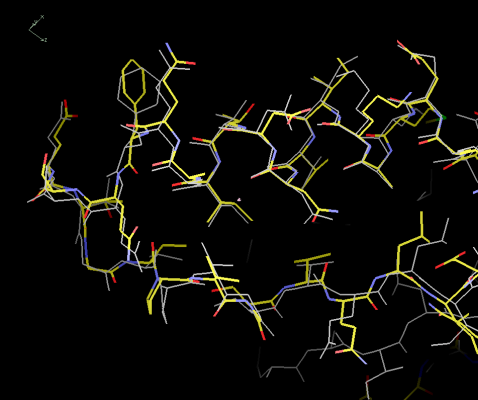
Figure 10: The
"buccaneer" model compared to the deposited structure.
The coordinates agree very well given that the resolution is
only 3.0Ĺ
The "buccaneer" model building software is extremely simple, relying on the application of a single likelihood function in several different ways to trace and sequence protein main-chains in experimentally phased electron density maps. The method is reasonably fast, taking minutes to an hour, and can give a partial trace even at low resolutions (i.e. worse than 3.0Ĺ). However the method is dependent on the quality of the initial experimental phasing and phase improvement results.
The method as presented here is incomplete, lacking removal of incorrectly traced features, refinement of the resulting model, or recycling to model completion. However "buccaneer" is already usable as a model building tool in conjunction with the "coot" software for structure completion (Emsley and Cowtan, 2004), and provides a suitable basis for future development.