|
Graeme Winter (g.winter@dl.ac.uk)
Daresbury Laboratory,Kecwick lane Warrington WA4 4AD
Automation and data processing are discussed, followed by a description of a software package ``XIA-DPA'' for automated data processing & analysis.
Processing X-Ray diffraction data can be a pain. It's fiddly, time consuming and often requires careful decision making to get the best from the data. However, careful processing is often critical to the structure determination process. To some extent, ``automation'' can help.
Often the easiest to use tool is not the best, and many programs have interfaces which are best accessed through inherited command scripts. Again, ``autmation'' can help.
To some people it is an ``intelligent GUI'' (e.g. CCP4i) which can help you to compose command scripts to programs and can chain together small programs to produce useful compound tasks. To others it may be a complete system for processing your data & solving the structure (e.g. Elves, Holton & Alber 2004). To some extent there is no right answer here - the appropriate level of automation will depend on the problem in hand. If your data are good and the problem relatively straightforward, then the complete automation approach may be appropriate. If, on the other hand, you are trying to push the boundaries of macromolecular crystallography then you might find yourself doing most of the work by hand.
Automating the process of protein crystallography is not a new idea. Operation of the beam lines, processing data and solving structures are already almost automatic procedures for simple cases. The differences are now in the scope of automation, and the domain of applicability. The scope is getting broader, with more steps in the process becoming integrated, for example in PHENIX, CCP4 and DNA. The emphasis is also changing, moving away from simple cases to become more generally applicable.
The strongest area for applying automatic techniques has historically been in the structure solution post data processing (e.g. CHART (Emsley, CCP4 Newsletter No. 36), SHELX C/D/E (Sheldrick & Schneider, 1997), SOLVE/RESOLVE (Terwilliger & Berendzen, 1999) and Arp/wArp (Lamzin, Perrakis & Wilson, 2002). At this stage one can generally assume that the data will be of at least a reasonable quality, and no steps are irreversible. There has traditionally been less emphasis on the automation of data processing, although Elves (Holton & Alber, 2004) includes ``Wedgers'' to perform this task.
Applying automation techniques to data processing offers a couple of key advantages. Firstly the results will be reproducible, since exactly the same procedures will be followed every time. Secondly, the decision about the best program to use will not be limited by the user's experience, for instance preferring one program over another due to familiarity alone. Finally, for novice users and those who care more about the biology than the technique, the processing and analysis can be performed with little or no effort.
One area where automation of data processing is critical is in remote and automated data collection, in the DNA 1and e-HTPX 2 projects. In e-HTPX, a key aim is to allow the remote user to process and analyse the data collected on their behalf. Traditionally this would involve providing a remote graphical interface to the data processing packages. Automating data processing can allow the same functionality but with far fewer transactions, making remote access more reliable. To this end, a small suite of programs for automated data processing and analysis, XIA-DPA, has been developed and will be described here. Finally, a key aim of the automation of data processing in e-HTPX is to ensure compatibility with other ongoing automation efforts, in particular DNA and CCP4, with the HAPPy and BMP projects.
The processing of X-Ray diffraction data is already reasonably automatic. With a relatively small number of keystrokes and mouse clicks an experienced user can go from a sweep of diffraction images through to intensities or structure factors. There are, however, a small number of ``gotchas'' which can upset the process, including:
These are frustrating in that they require concentration, which may be in short supply during a long synchrotron visit.
There are a large number of tools available for data processing, with different strengths and weaknesses. Tools such as Mosflm/CCP4 & HKL2000 provide the user with a complete suite and complete graphical user interfaces. This, combined with modest documentation, can help the most inexperienced user to to a reasonable job. However, the provision of a user interface implies an important component: the user. The features they should be looking for (e.g. spot profiles, lattice penalties) can be explained in vague terms, then experience gained. This is harder for an automated data processing system. A solution is to combine tools which are most amenable to automation with expertise to handle the decision making & judgement - between them the challenges may be overcome.
XIA, a crystallographic infrastructure for
automation, is derived from software developed for the DNA project, and
essentially provides a small ``core'' of tools for running software in an
automated environment. On top of this the ``DPA'' toolkit has been developed,
to provide a set of automated programs for data processing & analysis of
X-Ray diffraction data, building on a number of commonly available tools,
including Mosflm (Leslie, 1992), Labelit (Sauter, Grosse-Kunstleve & Adams,
2004), XDS/XSCALE (Kabsch, 1988a/b), Pointless (Evans, unpublished) and the
CCP4 suite. The objective of the suite is to provide some small ``macro'' tasks
which make use of the (in the author's opinion) currently best programs for
each given task, although it is straightforward to incorporate new and improved
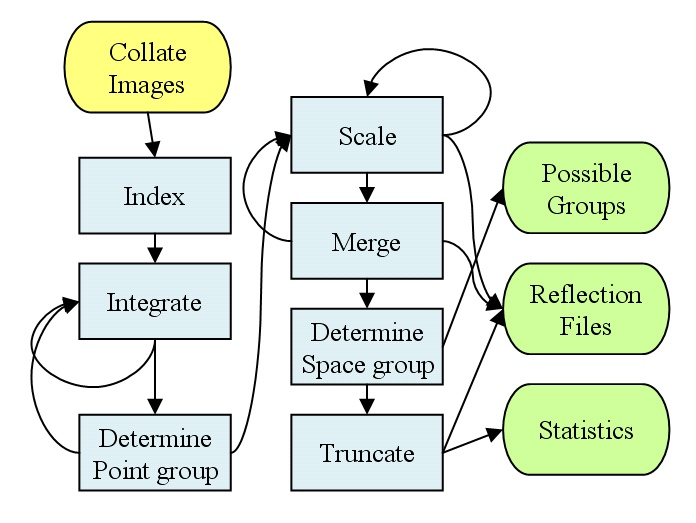
programs. The core of the suite consists of two programs,
xia-autoprocess-2d and
xia-autoprocess-3d, which perform the
operations shown in Figure
1.
This flow will not be news to anyone familiar with processing & analysing diffraction data, but it does include a couple of gremlins - like performing the scaling correctly and getting ideas of the possible spacegroups. Such things are straightforward, and indeed have ``been done'', but need to be considered when automating.
Essentially, the ambition of XIA-DPA is to
... from only the frames.
At the moment the software (version 0.1.4) is available at the SRS Daresbury and ESRF - please contact the author if you would like access.
Properly automated software (indeed, ideally all software) shouldn't need a manual. However, some guidance for the user is always useful. The programs in XIA-DPA all have the same general user input style:
xia-\${tool} [options] /path/to/image.img.
It is worth making a new directory for working in since this will make a lot of files!
Much of the test data used in developing DPA has been provided by the Joint Structural Genomics Consortium 3. The example data sets which led to the structure 1VPJ were of particularly good quality, and hence represent a simple example set to show the process.
To get the ball rolling the following commands were issued:
2d> mkdir infl lrm peak
2d> cd infl/
2d/infl> xia-autoprocess-2d \
/media/data1/12287/12287_1_E1_001.img > autoprocess.log 2>&1 &
[1] 19206
2d/infl> cd ../lrm/
2d/lrm> xia-autoprocess-2d \
/media/data1/12287/12287_1_E2_001.img > autoprocess.log 2>&1 &
[2] 19215
2d/lrm> cd ../peak/
2d/peak> xia-autoprocess-2d \
/media/data1/12287/12287_2_001.img > autoprocess.log 2>&1 &
[3] 19224
Following which, the author went to find a cup of coffee. On return the processing was complete. There were a large number of files in each directory, but the key ones were (in infl above):
2d/infl> ls *mtz *log *sca
12287_1_E1_001.mtz             3_ipmosflm.log
12287_1_E1_090.mtz             3_pointless.log
12287_1_E1_.mtz                4_ipmosflm.log
12287_1_E1_scaled.mtz          4_reindex.log
12287_1_E1_scaled_reindex.mtz  5_ipmosflm.log
12287_1_E1_scaled.sca          autoprocess.log
12287_1_E1_scaled_sorted.mtz   messenger-1133866582.log
12287_1_E1_truncated.mtz       messenger-1133866604.log
2_ipmosflm.log                 messenger-1133866851.log
The files 12287_1_E1_scaled.mtz
and 12287_1_E1_truncated.mtz
are the merged intensities and structure factors in CCP4 MTZ
format, and 12287_1_E1_scaled.sca
contained the unmerged but scaled reflections in unmerged scalepack format. The
standard output of the processing script going to autoprocess.log
contains much useful information, some of which is highlighted
below.
The first section of the output describes the data set:
--------------------------------------------------------------
Data set: 12287_1_E1_###.img
Directory: /media/data1/12287
Number of frames: 90 (1 to 90)
           ----------------------------------------
First frame: /media/data1/12287/12287_1_E1_001.img
First frame header information:
Direct beam:     105.100 101.050
Distance:            170.00
Wavelength:            0.97966
Energy (eV):       12655.86052
Resolution Max (A):    1.22525
Dimensions:  2048  2048
Pixel dimensions:  0.10240  0.10240
Oscillation range:  290.000  291.000 (1.000)
--------------------------------------------------------------
Data collection from: Sun Sep 26 14:01:35 2004
                to:   Sun Sep 26 14:22:03 2004
--------------------------------------------------------------
The information included here is derived entirely from the image headers, and is very helpful in the above example, since the order in which the data were collected could be derived - useful in the later analysis.
After the description of the data set, the results of autoindexing were displayed, including the references for the programs used:
Autoindexing using images: 1 90
Autoindexing results:
Spacegroup: P4 (75)
Cell: 51.850000 51.850000 158.130000 90.000000 90.000000 90.000000
Mosaic: 0.075000
Refined beam: 108.930000 105.040000
RMS Deviation (mm): 0.048000
References for programs used:
Program: labelit.screen
Robust indexing for automatic data collection.
N.K. Sauter, R.W. Grosse-Kunstleve, and P.D. Adams.
J. Appl. Cryst. 37, 399-409 (2004)

Program: ipmosflm
Leslie, A.G.W., (1992), Joint CCP4 + ESF-EAMCB Newsletter
on Protein Crystallography, No. 26.
... always helpful when writing up. The results
of cell refinement and integration then follow, which are rather verbose and
won't be included here, since they are best viewed through CCP4i's
loggraph. Once the integration
is complete pointless
(Evans, unpublished) is used to determine the most likely point group:
Reindexed (pointless) from P 4 to P 4 2 2
A small cad
script is included, in the cases where the correct lattice is
higher than that used in integration, to appropriately constrain the cell
parameters for the higher symmetry. Once the point group has been determined
the scaling proceeds, with some parameter refinement. Again, there is some
output best observed through loggraph, followed by:
Data set summary statistics:
Resolution range: 52.56 - 1.44  (1.52 - 1.44)
Rmerge:           0.095         (3.386)
Completeness:     84.21         (39.95)
Multiplicity:     5.65          (2.18)
I/sigma:          9.21          (0.42)
N obs:            189003        (4858)
N unique:         33450         (2232)
Resolution estimates: I/sig     Resolution
                       1.00    1.52
                       2.00    1.61
                       3.00    1.66
A summary of the merging statistics. Finally, the systematic absences are analysed and compared with theoretical values computed from the CCP4 symmetry libraries to give:
Likely spacegroups:
p 41 21 2
p 43 21 2
Like all output from the program, this should be taken as advice rather than fact. However, this may greatly reduce the amount of time taken to test all of the possible spacegroup options.
From the descriptions of the data set, the author
discovers that the inflection and low remote passes of the data set were
collected first (and at the same time) followed by the peak. It is therefore
possible that the peak wavelength is affected by radiation damage. As an
initial assessment, the command xia-multi-radiation
was used to get the relative ![]() and
and ![]() factors between the wavelengths:
factors between the wavelengths:
2d/infl> cd ..
2d> mkdir compare
2d> cp */*truncated.mtz compare/
2d> cd compare/
2d/compare> xia-multi-radiation 12287_1_E1_truncated.mtz \
12287_1_E2_truncated.mtz 12287_2_truncated.mtz
B factor =  0.000
B factor = -0.249
B factor = -1.972
R factor =  0.000
R factor =  0.082
R factor =  0.142
References for programs used:
Uncited program: cad

Uncited program: scaleit
indicating that the peak had a large relative ![]() factor and a poor
factor and a poor ![]() factor. When phasing later, the results may be better excluding the peak. As a
test the structure was solved using Solve/Resolve and Arp/wArp using as both
two and three wavelength MAD, resulting in
factor. When phasing later, the results may be better excluding the peak. As a
test the structure was solved using Solve/Resolve and Arp/wArp using as both
two and three wavelength MAD, resulting in
| set |
|
Res/Chains start | Res/Chains final |
| 3 |
26.7/31.7 | 158/3 | 164/3 |
| 2 |
21.0/23.4 | 170/5 | 173/4 |
indicating both that the data were good enough to automatically solve with no ``clever'' user input, and also that the results were improved (slightly) by the exclusion of the peak. The initial number of residues docked by Arp/wArp is an interesting metric, since it essentially represents the tracability of the first map.
This was a much more challending case for the automated data processing, encountered during a SPINE WP7 workshop in York (publication pending). The data were collected from a triclinic crystal in two runs, low (2.3 Ĺ) and high (1.5 Ĺ) resolution, at the ESRF ID14 EH1. The data were manually processed with Denzo and Scalepack, and a solution via molecular replacement was found. However, the refinement and rebuilding of this solution failed, and the processing of the high resolution data was believed to be responsible.
Automatically processing with the 2D pipeline
shown above resulted in similar data. However, processing with the 3D pipeline
gave datasets which appeared to have more reasonable second moment statistics.
This illustrates the flexibility of being able to use multiple programs - the
high mosaic spread gave rise to reflections spread over many images in the high
resolution pass (![]() oscillations,
oscillations,
![]() ),
requiring the use of a 3D integration program to get the best measurements.
),
requiring the use of a 3D integration program to get the best measurements.
In the above simple example there was nothing
which could not have been done, possibly better, by hand. However, the process
would have been time consuming and possibly error prone. As it stands the
structure was solved with essentially no user effort, only the results of data
collection (the frames and ![]() and
and ![]() values), a small amount of information about the sample (sequence & number
of Se atoms) and processing results were used.
values), a small amount of information about the sample (sequence & number
of Se atoms) and processing results were used.
In the second example the automation did not completely solve the problem, but it did substantially help. Being able to process the data automatically with two separate pipelines and compare the results ensured that the best processing results were found quickly.
The CCP4 Suite: Programs for Protein Crystallography, Acta Cryst. D50, 760-763.
Emsley, CCP4 Newsletter No. 36: http://www.ccp4.ac.uk/newsletters/newsletter36/08_chart.html
Holton, J. and Alber, T. (2004). PNAS 101, 1537-1542.
Lamzin, V.S., Perrakis, A. & Wilson, K. (2001) IUCR International Tables Volume F. 720-722.
Leslie, A.G.W., (1992), Joint CCP4 + ESF-EAMCB Newsletter on Protein Crystallography, No. 26.
Kabsch, W. (1988a). J. Appl. Cryst. 21, 67-71.
Kabsch, W. (1988b). J. Appl. Cryst. 21, 916-924.
Sauter, N., Grosse-Kunstleve, R., and Adams, P. (2004). J. Appl. Cryst. 37, 399-409.
Sheldrick, G. & Schneider, T. (1997) Methods in Enzymology 277, 319-343.
Terwilliger, T. & Berendzen, J. (1999) Acta Cryst. D55, 849-861.
This document was generated using the LaTeX2HTML translator Version 2002-2-1 (1.70)
Copyright © 1993, 1994, 1995, 1996,
Nikos Drakos, Computer Based
Learning Unit, University of Leeds.
Copyright © 1997, 1998, 1999,
Ross Moore, Mathematics
Department, Macquarie University, Sydney.
The command line arguments were:
latex2html -split 0 Newsletter.tex
The translation was initiated by Graeme Winter on 2005-12-19