------------ CCP4 Newsletter - January 1997 ------------
List of sections:
Basis of the Method
Potential Problems
Initial Trials
Programs Used
The FFT Grid
Steps Followed
Yeast PGM - Simulated and Real Data
Example Datasets Used
Results from Real Examples
Conclusions
References
Acknowledgements
The basis of the method is simply that the Fourier Transform can provide a direct transformation between a reciprocal lattice (which may be determined experimentally) and a real space set of vectors from which the cell vectors and the cell orientation may be found. In theory this should provide a more direct route to the required information than the more usual procedures involving the determination and clustering of difference vectors in reciprocal space (see refs. 2, 3 & 4).
To carry out the procedure, a fine three dimensional orthogonal reciprocal lattice grid (parallel to a set of laboratory axes) is set up. A set of reciprocal lattice points is determined from the observed diffraction data. For each of these reciprocal lattice points, an 'intensity' value of 1.0 is assigned for the nearest grid point of the othrogonal lattice. All other points of this orthogonal lattice are assigned intensities of zero. A three dimensional Patterson function is then computed from the orthogonal lattice using an FFT program and the resulting Patterson function is searched for the vectors to determine the cell and its orientation.
A number of problem areas are obvious. In the first instance, it is necessary to carry out the calculations using a 'fine' grid for the 3-dimensional FFT as the finer the grid, the less will be the rounding errors is assigning the observed reciprocal lattice points to the nearest FFT grid points. How fine this grid needs to be in practice is probably one of the main factors determining whether the method has practical value using today's computers.
Assuming a sufficiently fine grid can be used, the following problem areas still remain.
Some initial trials were carried out in one and two dimesions using grids from 2048 down to 512 points with a data resolution of 1.0 Angstroms and cell parameters up to about 85 Angstroms. Typically a random sample of 5% of the precicted reciprocal lattice points data was included in the FFT calculation. As the results seemed promising, the trials were extended into three dimensions. The first trials in three dimensions were carried out using a grid of 512x512x512 points. Although again they looked promising, the computation time for such a 3-D FFT was taking around 13 minutes of cpu time with an elapsed time of around 45 minutes on an Indy workstation. This basically suggested that the method was unlikely to be practical unless a coarser grid could be used and a grid of 256x256x256 was then tried. This reduced the cpu requirement to less than 2 minutes and it was this grid that was used in all the subsequent examples unless otherwise stated. Such computaion time could probably be significantly reduced by resticting the number of grid divisions grid to a power of 2 and making more use of the fact that the input data are very sparse.
The main programs used in the trials were the FFT and PEAKMAX programs from the CCP4 program suite and IMSTILLS from the MOSFLM suite. A series of jiffy programs were also written and used.
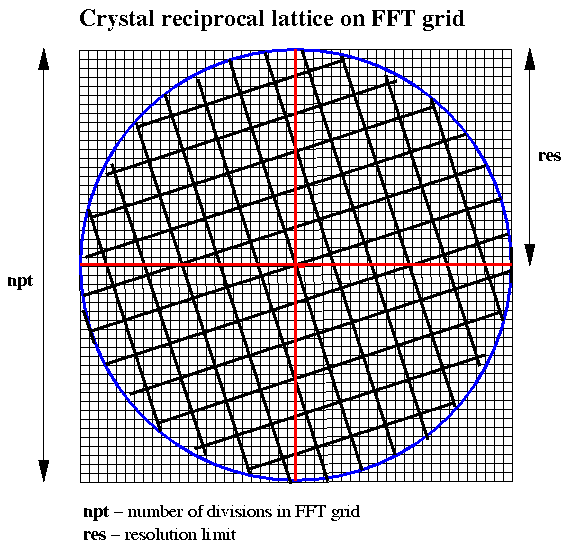
As indicated above, almost all the trials were carried out using a grid of 256x256x256 for the FFT calculations. This meets the following requirements:
Figure 1 Choice of FFT Grid for Crystal Data of a Given Resolution

Let npt be the number of divisions in each dimension of the grid and res be the resolution of the data to be used, then the cell size for the 3-D Patterson function to give vectors of the correct dimensions is given by:
FFT cell size = npt*res/2.0The grid spacing rlgrid is given by:
rlgrid = 2.0*alam/(res*npt)where alam is the wavelength at which the data are collected.
The FFT grid corresponds to a index range of (-npt/2 + 1) to (npt/2 - 1)
The conversion of a reciprocal lattice point (dimensionless) to the nearest indices (hkl) for the FFT input data is given by:
   h = NINT (x/rlgrid)
   k = NINT (y/rlgrid)
   l = NINT (z/rlgrid)
where x,y,z are the dimensionless reciprocal lattice coordinates for an observed reflection.
It is probably desirable when it comes to searching for vectors in the 3-D patterson function that the primary cell vectors should be less than half the FFT cell dimension in length. If the FFT grid is to be restricted to 256, then this means that the resolution of the data to be included in the calculation will need to be restricted to give a sufficiently large FFT cell based on the expressions given above. For a cell of 200 Angstroms the data input would need to be restricted to a resolution of say 3.5 Angstroms whilst for a cell of 100 Angstroms, 2.0 Angstrom data would be suitable.
The calculations were carried out in the following stages:
For simulated data, use a temporary version of the program ROTGEN with a modified spots output routine linked in.
PVEC and PVEC_REFN select peaks above a requested threshold, find the vector lengths within a requested range and output details of the vectors selected and the angles between them. The PVEC_REFN attempts some preliminary refinement of these vectors using the reciprocal space data using a general least squares routine or a method described by Clegg for refining 't' vectors (ref 1.).
CELL_VEC allows for a search of any solutions for which each of three vectors are within given ranges and are separated by requested minimum angles.
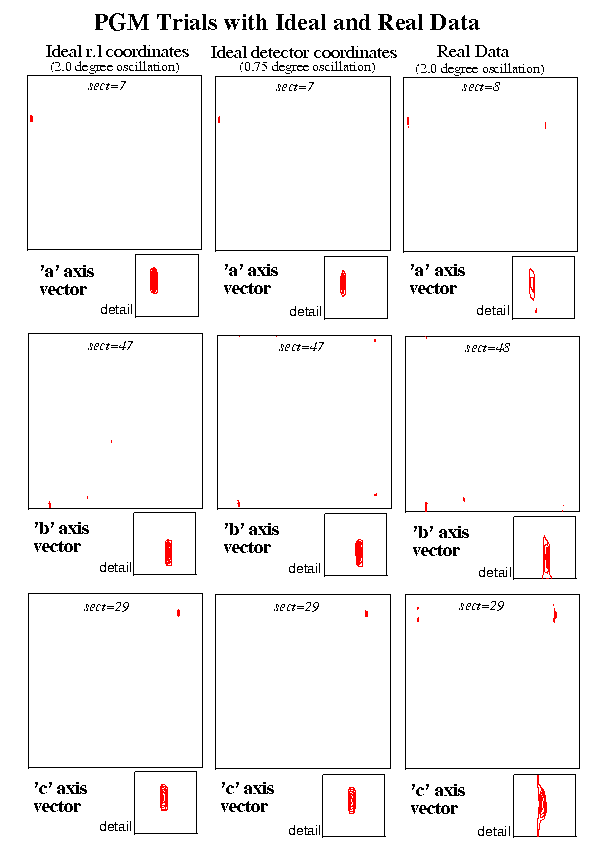
Two simulated data trials were carried out for a crystal of the enzyme Yeast Phosphoglycerate Mutase (PGM) (Monoclinic, C2, a=96.2 b=85.8 c=81.9 beta=120.5). In the first of these, the ideal three dimensional reciprocal lattice coordinates were calculated (using a modified version of ROTGEN) for the reflections which would occur on a two degree oscillation image. In the second case data were calculated for a 0.75 degree oscillation image again using a modified version of ROTGEN. In this case the reciprocal lattice points were calculated from the predicted spot positions on the detector thus including the unavoidable source of error due to the use of a finite oscillation angle. The procedure was then applied to the first real set of data, a 2.0 degree oscillation PGM image recorded on image plate (small MAR). All three sets corresponded to the same orientation of the crystal. A crystal to image distance of 250.0 mm was used for the simulated data and the experimental distance of 137.0 mm was used for the real data.
Using the jiffy programs described above, the Patterson peaks were analysed and in each case the unit cell vectors could be clearly seen. Other high peaks obviously resulted from vectors to the 'C' centre, across the cell faces etc. In this example the cell vectors are all of a similar magnitude and the vectors corresponding to multiples of the unit cell were outside the range examined. Such multiple cell length vectors were however clear in some of the other examples described below.
The sections of the Patterson map containing the peaks corresponding to the cell vectors are illustrated for the two sets of simulated data and the real data.
Figure 2 PGM Trials with Ideal and Real Data

For the real data, a series of runs were done making adjustments to the initial starting position for the centre of the primary beam. The best position for the beam, as judged by the closeness of cell dimensions obtained to those of a reference set, was very close to that of the refined centre position from a run of MOSFLM. The results were encouraging in spite of large oscillation range used and in spite of the fact that the 3.0 Angstrom data used occupied only the central section of an image recorded to 1.8 Angstroms resolution.
The following table gives a complete list of the protein crystals used in the indexing trials:
Table 1: Protein Crystals used for Auto-Indexing TestsAll data used were collected on the Daresbury SRS. The PGM images were collected by H.C. Watson and J.W. Campbell. The LYS, PRI and PST images were collected by E.M.H. Duke and the NPL and INS images were collected by P.J. Rizkallah and M.Z. Papiz.Code Protein Space-group
PGM Yeast Phosphoglycerate Mutase C2
LYS HEWL Tetragonal Lysozyme P43212
PRI Prismane protein P212121
PST Pig Serum Transferrin C2
NPL Narcissus Pseudonarcissus Lectin C222
INS Insulin P212121
The parameters used for the recording and processing of the test images (one from each dataset) are shown in the following table:
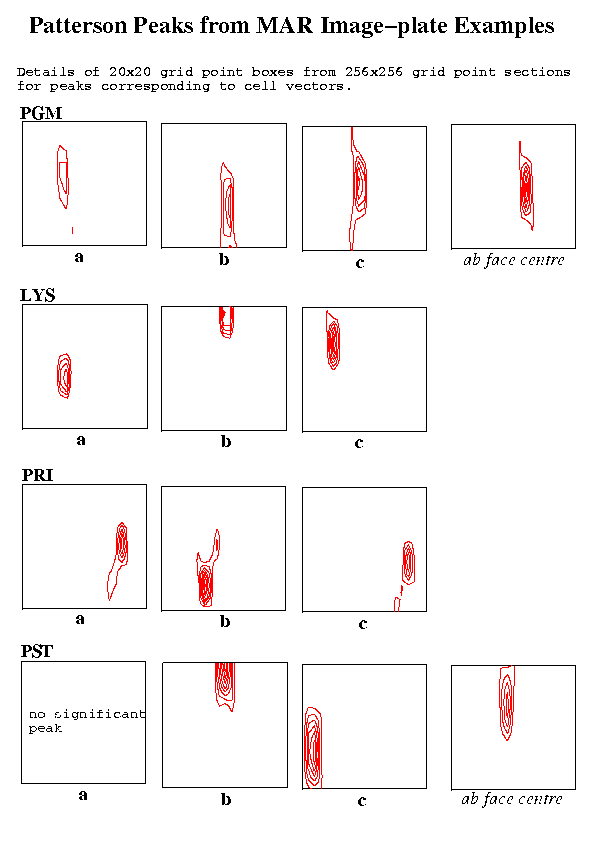
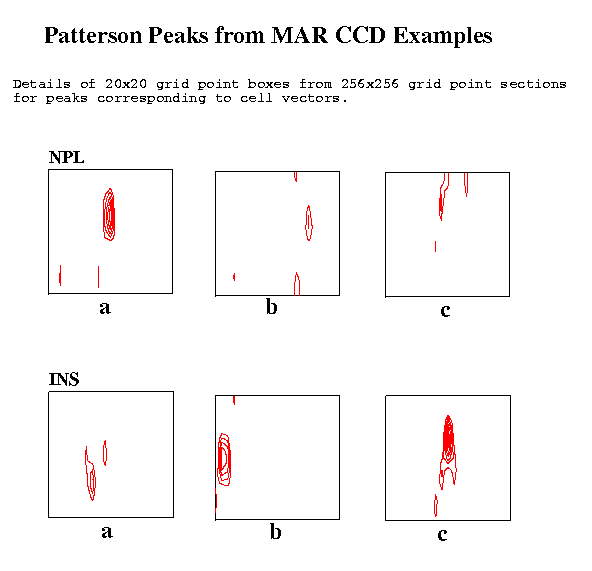
Table 2: Parameters used with example datasetsTwo figures show the Patterson peaks at the ends of the unit cell vectors. In each case a detail for the section (a 20x20 grid point box) is shown. The elongation of the peaks in the vertical direction on the plots corresponds to a elongation in the direction of the X-ray beam and is presumably due to the lower resolution of the recorded reciprocal lattice data in that direction.Sample Detector Lambda ctof Osc. Resolution No. FFT Peaks-in-FFT type type (A) (mm) angle Obs. Used spots cell rms thresh
PGM IP 1.00 137.0 2.0 1.8 3.0 278 384.0 4.24 30
LYS IP 0.92 310.0 1.0 2.1 2.5 311 320.0 4.00 35
PRI IP 1.70 270.0 1.5 3.4 3.5 232 448.0 4.77 50
PST IP 0.92 310.0 1.0 2.1 2.5 206 320.0 4.93 50
NPL CCD 0.87 90.0 1.0 1.4 2.5 162 320.0 5.56 30
INS CCD 0.87 90.0 0.1 1.4 2.5 141 320.0 5.95 40
Note: Grid for FFT was 256 in all cases
Figure 3 Patterson Peaks from MAR Image-Plate Examples

Figure 4 Patterson Peaks from MAR CCD Examples

As might be expected, the weakest of the three unit cell vectors in the PGM example was the one lying approximately in the direction of the X-ray beam. The effect of sparser data in this direction and also the finite size of the oscillation angle are presumably factors affecting such peaks. The two degree oscillation angle is probably larger than desirable in any case but it is encouraging that the required vectors are nevertheless still well defined. The vector to the 'C' face centre is stronger than that of the 'a' vector and is also shown in the first figure.
In both the LYS and PRI cases, all the desired vectors showed up well.
The most disturbing result was in the case of the PST crystal (C face centred, monoclinic cell) where the 'a' axis vector could not be detected. On the other hand, the vector to the face centre gave a strong peak and the choice of this vector with the two other clearly identifiable cell vectors gave a valid primtive cell. The FIND_ORIENT program was used to determine the crystal orientation for this primitive cell and a simulation using ROTGEN gave a good match to the observed image. The procedure was repeated using 3.5 Angstrom data with a 256x256 grid and also 3.0 Angstrom data with the finer 512x512x512 grid. In both these cases, the 'a' vector could be seen.
The NPL data collected on the MAR CCD system gave reasonable peaks for the cell vectors.
The INS data were collected in narrow phi slices of 0.1 degrees and, as in the other cases, a single image was used. Though, in this case, not given the cell dimensions but given that the cell was orthorhombic, the cell dimensions were readily determined.
The results of the cell determinations are shown in the following table together with reference values for comparison.
Table 3: Determined and reference cell parameters.Test ---Determined-cell-parameters---- ----Reference-cell-parameters----- a b c alph beta gamm a b c alph beta gamm
PG 97.1 85.7 82.7 90.5 121.4 89.0 96.2 85.8 81.9 120.5
LYS 79.5 80.6 38.3 86.4 87.7 89.8 79.6 38.5
PRI 65.0 65.9 154.8 90.1 90.5 89.7 65.1 65.7 155.2
PST -- 45.2 79.6 90.0 -- -- 224.8 45.2 79.2 45.2 79.6 116.6 106.6 101.3 90.0 45.2 79.3 114.7 104.9 101.3 89.9
NPL 71.8 101.1 38.3 89.2 86.3 90.9 73.1 100.9 37.0
INS 52.8 57.7 36.2 91.4 91.3 90.8 50.9 56.9 37.1
Table 4: Peak heights in the Patterson of cell vectorsIt was generally observed that peaks with heights of 30 or more were found for the expected vectors. With the current refinement procedures for the individual 't' vectors, the examples show errors of up to about 3% in the lengths of the cell vectors found and up to 3.7 degrees in the cell angles.Sample ------Peak- Height------ a b c ab-cen
PGM 35.0 55.0 62.5 73.6
LYS 61.3 75.8 57.7
PRI 62.0 85.9 59.8
PST -- 96.1 76.7 56.0
NPL 33.7 32.1 67.2
NPL 40.0 60.5 76.6
The results obtained would seem to confirm that the proposed method could be put to practical use. A customised program would need to be written incorporating the stages described with particular emphasis on speeding up the FFT calculation step. The refinement of the individual potential cell vectors also needs further attention. Having selected suitable cell vectors, the stages following that including refinement of the cell and its orientation, cell reduction etc. would be analogous to that used in already well established procedures.
As with other auto-indexing or orientation determining procedures, it is important to have good values for the centre of primary beam position and the crystal to image distance.
My thanks are due to Phil Evans (MRC Cambridge) for drawing my attention to the subject and to my colleagues at the Daresbury laboratory, in particular Liz Duke, Pierre Rizkallah and Miroslav Papiz for making available some test images for the trials.