Newsletter contents...

To make things much easier for both the users of the bulletin board and us writing this
newsletter, members who ask questions or instigate discussions on the board
are now asked (urged!) to post a summary of all the reactions received, whether on or
off the board.
For each subject below, the original question is given in italics, followed by a summary of the
responses sent to CCP4BB (together with some additional material). For the sake of clarity and brevity, I
have paraphrased the responses, and all inaccuracies are therefore mine. To avoid misrepresenting
people's opinions or causing embarrassment, I have tried not to identify anyone involved.
Those that are interested in the full discussion can view the original messages on the
CCP4 Bulletin Board Archive.
These summaries are not complete, since many responses go directly to the person asking the question.
While we understand the reasons for this, we would encourage people to share their knowledge on
CCP4BB, and also would be happy to see summaries produced by the original questioner. While CCP4BB is
obviously alive and well, we think there is still some way to go before the level of traffic becomes
inconvenient.
Thanks to all the users who are now dutifully posting summaries. Also I would like
to thank Eleanor Dodson for her corrections and additions.
Subjects covered in this newsletter's offering
- MOSFLM
-
- MOSFLM, XDS, DENZO - conversion of crystal missetting angles
- And: how to deal with low resolution diffraction and partially recorded reflections
- MOSFLM - ignore overlap??
- see also Data processing
- Data processing
- Data processing - indexing problems
- Dodgy indexing, or dodgy mosaicity
- Rsym and Rmerge, what are the differences?
- Water rings, ice rings
- see also Twinning, indexing, re-indexing
- Twinning, indexing, re-indexing
- Indexing Relationship Table
- I222 to P212121
- Indexing in I222
- Tetragonal Twinning & Detwin
- Twinning problems (again....)
- see also Data processing
- B-factor
- B-factor and resolution
- Anisotropic ellipsoids
- Movies and other picturesque queries
- Structural Transition
- Digital Imaging of Crystals
- Image production
- How to control the size of .ps files in NPO
- Movies for powerpoint
- Stereo figure from molscript
- How to generate postscript files, and how to
achieve the correct resolution
- 'Hardware' (and some Software)
- Oils and cryo-protection
- System backup devices
- Dry shipper container
- Crystal growing cabinets and crystallisation incubators
- Replating anodes
- Physical models
-
- Dynamic light scattering
- Interpreting DLS - discrete dimer vs. random assembly
-
- Filters for DLS measurements
- RedHat7*
- Chemical discussions
-
- Selenomethionine
- Selenomethionine oxidation during RP-HPLC
- Se-Met and X-ray absorption (lecture by BR)
- Selenomet from O and REFMAC5
- see also Atoms used for anomalous dispersion
- Glycerol - bad or good?
- Monovalent cations
- Atoms used for anomalous dispersion (a survey)
- Beryllium Fluoride-ADP
- Mercury Phenyl Glyoxal
- Various
- XYZ-limits and real space asymmetric units
- Contour levels
- REJECT in SCALEPACK2MTZ
- Real space difference map
- Non-proline cis-peptide
- Large beta-angle in C2
- Reflection vanishing act
- Structure family
- Stereo net
- GETAX
- How to combine phases from various sources
- Molecular Replacement with Zn2+ as anchoring point
- Rfree vs resolution (complete with graph!)
- Trouble interpreting self-rotation
- A note on CCP4BB 'rules'
- Announcements
- HIC-Update
- RAVE (MAPMAN, etc.) for LINUX
- CCP4 v4.1
- CCP4 v4.1.1
- MOSFLM - release of version 6.11
- MOLREP 7.0
- ACORN in CCP4
- More tutorials for SFTOOLS etc.
- Eleanor
- cctbx - Computational Crystallography Toolbox
- AutoDep 3.0
- New Version of PDB mode for Emacs
- PyMOL v0.56 (+ Windows Installer)
- Updated Tcl/Tk/BLT on CCP4 ftp server
MOSFLM
MOSFLM features fairly heavily on the CCP4 Bulletin Board, both for crystallographically
related queries and for problems related to installation on various computers. Most questions are
answered very quickly by Harry Powell,
who is also most happy to answer questions put to him directly.
MOSFLM, XDS, DENZO - conversion of crystal missetting angles
Also: how to deal with low resolution diffraction and partially recorded reflections
(February 2001)
I have a ~6Å dataset which I can index in XDS but so far not in MOSFLM or
DENZO.
Is there a simple way to convert the crystal missetting angles as given in
XDS to the conventions used in MOSFLM or DENZO? I would like to try
integrating the data in MOSFLM and in DENZO as well.
The images are weak, one of the axes is almost perfectly aligned with the
spindle axis and, as written, the resolution poor. XDS probably succeeds
because it can use more frames than MOSFLM (6.1) or DENZO.
- XDS2MOS
- Richard Kahn (Grenoble) has written such a program (XDS2MOS). It produces a
MOSFLM indexing matrix from GLOREF.LP. It needs a modification to use IDXREF.LP
as input in case GLOREF does not work, which is the case with very low
resolution data.
-
 |
Experience is based on a dataset of crystals from low density lipoproteins (LDL).
Resolution between 28 and 15Å, unit cell: 200, 400, 400Å, C2.
This is certainly an extreme case, but it shows the limits clearly.
Image from
Lunin et al.,
Acta Cryst. D57, January 2001, 108-121 (click on thumb-nail to enlarge). |
XDS can use your whole dataset for indexing if you like. The point is, that
XDS constructs 3D profiles already in the indexing steps and everything is
done in batch which is a great advantage if you need a lot of images for
indexing.
- MOSFLM
- While there is a limit on the number of images you can use in MOSFLM for
indexing, this number is large enough (it's 20 for all indexing options, as from
version 6.11) to provide a sufficient sampling of reciprocal space to successfully
index most datasets. The images don't have to be adjacent to each other.
- Weak images, too, often don't seem to bother it. It is certainly possible to
index images using just 10 spots, all worse than 4Å.
- The only thing that does seem to matter is the beam position, but that seems
to apply to all programs. The old MOSFLM indexing algorithm (the
one you get when you say "no" when asked whether to use DPS),
seems a bit more robust about the beam centre, but then you need strong
images and certainly include spots from several images widely separated in
phi. Harry adds: "You need to know the beam position to within half the
minimum spot separation for any autoindexing to work or the indexing will be
incorrect even if it seems to work".
- Also be very aware that the x and y convention is switched between
some programs. Where MOSFLM uses (x,y), DENZO and D*TREK use (y,x).
Harry adds: "There's still a jiffy program around which will do the conversion
from DENZO to MOSFLM indexing (from the days before the "new-style"
indexing); see
ftp://ftp.mrc-lmb.cam.ac.uk/pub/pre/denzo2mosflm.f".
- MOSFLM has (had?) a problem with the integration of reflections extending over
many images. Work on this is in progress, and the code for it is robust enough to
be used cautiously. Keep in mind that SCALA (see
Appendix 1:
Partially recorded reflections) has options to deal with these results effectively.
- DENZO/HKL2000
- Denzo uses only one image and HKL2000 can index on multiple
images. Several people tried to index very low resolution data by
HKL2000 and DENZO but it did not work.
Summary from the enquirer:
Good knowledge of the beam center was pointed out as important for a successful
indexing. The (x,y) convensions are program specific.
I used the modified version of Richard Kahns program XDS2MOSFLM to get a
MOSFLM orientation matrix. The CCP4 ROTGEN program could easily do the
conversion between MOSFLM and DENZO. The data could be integrated in XDS
and MOSFLM though DENZO (vers. linux_1.96.5) had problems fitting
parameters probably because it only uses one image at a time. I briefly tried
D*TREK (7.0) for indexing but giving it a fair chance to succeed remains.
MOSFLM - ignore overlap??
(November 2001)
Does anybody happen to know if there is a MOSFLM keyword to ignore
overlap?
Try looking at the SEPARATION keywords. If you don't have the mosflm.hlp
files handy, check out
synopsis.cgi
which does a simple-minded markup of the help file.
I'd guess (without examining your images) something like
SEPARATION x y CLOSE
(where x and y are the spot separation in x and y) might help.
However, as the help file says:
**** IT MUST BE REALISED THAT THIS WILL LEAD TO SOME DETERIORATION IN DATA
QUALITY. IT IS FAR BETTER TO USE A SMALLER ROTATION ANGLE OR BETTER
COLLIMATION TO REDUCE THE NUMBER OF OVERLAPS IF THIS IS POSSIBLE ****
Data processing
Data processing - indexing problems
(March 2001)
I have a dataset at 3Å resolution, synchrotron source, 1 degree frames, 180
degrees; frozen crystal, reasonable mosaicity.
DENZO table looks like this:
------------------------------------------------------------------------

Lattice          Metric tensor    Best cell (symmetrized)
              distortion index    Best cell (without symmetry restrains)

primitive cubic         14.85%  88.62 151.10  89.21  90.00  86.54  89.81
                               109.64 109.64 109.64  90.00  90.00  90.00

I centred cubic         26.41% 121.89 174.91 175.47  43.38 110.35 110.11
                               157.42 157.42 157.42  90.00  90.00  90.00

F centred cubic         26.61% 198.76 193.90 194.36  77.78  53.58  54.03
                               195.68 195.68 195.68  90.00  90.00  90.00

primitive rhombohedral  14.09% 174.91 151.10 175.47  30.56  40.71  30.44
                               167.16 167.16 167.16  33.90  33.90  33.90
                               105.25 105.25 471.14  90.00  90.00 120.00

primitive hexagonal     12.17%  88.62  89.21 151.10  90.00  90.19  93.46
                                88.91  88.91 151.10  90.00  90.00 120.00

primitive tetragonal     1.44%  88.62  89.21 151.10  90.00  90.19  93.46
                                88.91  88.91 151.10  90.00  90.00  90.00

I centred tetragonal     9.71%  88.62  89.21 325.58  75.07  75.38  93.46
                                88.91  88.91 325.58  90.00  90.00  90.00

primitive orthorhombic   1.43%  88.62  89.21 151.10  90.00  90.19  93.46
                                88.62  89.21 151.10  90.00  90.00  90.00

C centred orthorhombic   0.18% 121.89 129.49 151.10  89.87  90.14  89.62
                               121.89 129.49 151.10  90.00  90.00  90.00

I centred orthorhombic   9.71%  88.62  89.21 325.58  75.07  75.38  93.46
                                88.62  89.21 325.58  90.00  90.00  90.00

F centred orthorhombic   9.45% 121.89 129.49 325.58  89.73  68.15  89.62
                               121.89 129.49 325.58  90.00  90.00  90.00

primitive monoclinic     0.08%  88.62 151.10  89.21  90.00  93.46  89.81
                                88.62 151.10  89.21  90.00  93.46  90.00

C centred monoclinic     0.17% 121.89 129.49 151.10  89.87  90.14  89.62
                               121.89 129.49 151.10  90.00  90.14  90.00

primitive triclinic      0.00%  88.62  89.21 151.10  90.00  89.81  86.54

autoindex unit cell             88.62  89.21 151.10  90.00  89.81  86.54
------------------------------------------------------------------------
Indexing in primitive tetragonal or orthorhombic fails. C centred
orthorhombic, monoclinic, and triclinic all work nicely, and indexing and
integration are apparently OK.
The problems starts when scaling the data: all possibilities, except for
triclinic, produce unreasonable results (using 'default parameters').
Ridiculously high chi squares (50 or more!) in the first round, Rmerges
over 50%, huge rejection files (half the data!). In the following rounds,
chi squares 'drop' to 2 or so, but the rejection files grow even bigger,
and Rmerges are stuck.
Well, it must be triclinic...but the refined cell is the following:
89.211 89.214 150.819 90.000 89.989 87.153 ----> a=b, alpha=beta=90.
Furthermore, assuming a 50% water content, I would have 10 molecules in the
cell; a bit unlikely, and a real molecular replacement nightmare. On the
other hand, the low resolution diffraction limit could hint at loose
packing and high water content, and things might not be that bad.
Any ideas or suggestions? Where should one look for possible problems or
mistakes (before scaling)? I must confess my unease with symmetry, maybe
the DENZO table is showing me something that I cannot see.
Summary from the enquirer:
Here is a summary of the tips I received last week regarding my data
processing troubles (reminder: indexing and integration show center
orthorombic, or monoclinic, but scaling goes awry except for P1 with two 90
degree angles). Despite being specific for my problem, some of them might
turn useful for the inexperienced crystallographer.
- P1 90/90 can actually be true, it's the internal symmetry that defines
crystal system and space group
- try a different program (D*TREK, XDS, MOSFLM)
- unique axes could have been mixed up, swap them around
- wrong beam position can lead to misindexing by one
- scale in P1, make MTZ and use HKLVIEW to look for symmetry; it will still
be visible even if your indexing is 1 out whereas the
merging statistics will be completely destroyed..
- calculate self-rotation function, and check for symmetry
- crystal may be twinned
- a few alternative lattices were also suggested; this may be checked through
maXus Structure Analysis Software
Dodgy indexing, or dodgy mosaicity
(February 2001)
I'm trying to index a data set with DENZO. The problem is with
mosaicity - it looks about 1 but at this value it misses out some low
resolution spots and seems to overfit for the number of spots at high
resolution. Thought it might be misindexed but did a direct beam shot
and the beam values look about right. It manages to autoindex it fine
and the chi values are also fine.
First the obvious:
Try indexing with one of the other programs and compare the results.
Then a similar experience:
This reminds me of my (large) crystal when I measured a high resolution
data set at the synchrotron when we did not have enough time for the
low-resolution scan. Although the final mosaicity from SCALEPACK
postrefinement was lower than the input in DENZO (in the low resolution
range not all spots were detected) the mosaicity seemed to be higher.
The rest (autoindexing, chi^2, ... ) of the scaling was very smooth.
I made a compromize, taking a mosaicity slightly higher than the
postrefined from SCALEPACK for a second DENZO-SCALEPACK run. The
data-set was fine anyway up to high resolution!
I don't know exactly the reasons for this behaviour. Maybe the crystal
cracked a bit during freezing, or a small part of twinning (although
merohedral twinning is not possible in this space group)...
Then some practical advice:
Try to look at the background profile of some of those spots. DENZO
may refuse them if the background is too steep for it etc.
CAUTION with this: playing with these parameters may spoil your data
processing.
The mosaicity parameter in DENZO can be compared to the Lemon-Larson
peak integration limits for (small molecule) diffractometer scans. The
main volume of the peak is integrated and the 'tails' (in phi rotation
for oscillation photos) are excluded. The mosaicity chosen by
DENZO/SCALEPACK generally results in the best I/s for the reflection,
with only a fraction (<1% ?) of the total integrated intensity going to
the tails. This is not generally noticeable, except at low resolution
where the 'tails' have sufficient intensity to be observable in the
oscillation photo. Other reasons for observing unindexed reflections at
low resolution include TDS (thermal diffuse scattering). Increasing the
DENZO/SCALEPACK mosaicity parameter a 'little bit' is I believe a common
practice, and should not severely affect the data quality (I/s). While
using incorrect error models (in SCALEPACK) is probably a more harmful
and common practice to avoid.
What you describe is perfectly normal behavior (for DENZO, anyway). I
understand that it is difficult to model some reflections at low
angle that are spread out over many frames. They are often ignored.
Use as many frames as you want for integration of your data (HKL2000,
or denzo_3d). This gives you a very good estimate for the mosaicity
right during integration. If you are just using DENZO, integrate your
data, then scale them and re-integrate using the mosaicity value that
SCALEPACK gives you (add about 0.2). Keep in mind that the mosaicity
can change depending on crystal orientation, radiation damage, etc.,
that's why it is best to refine the mosaicity during integration in
the first place.
In any case, there will be reflections that won't be "predicted", for
various reasons. The most common is that they don't belong to the
main lattice (freezing artifacts, satellite crystals) or they come
from a different crystal altogether (salt). Furthermore, mosaicity,
or the sum of parameters that most integration programs call
"mosaicity", seems to be resolution dependent. As far as I know, no
program can model this in a satisfactory way. Don't worry about the
few unpredicted reflections. It seems that your data processing is
just fine.
In DENZO, mosaicity is defined as the smallest angle through which
the crystal can rotate about an axis or combination of axes while a
reflection is still observed.
From this definition, we can extend our logic for single crystal oscillation photography...
delta phi = ( smallest reciprocal cell constant / d*min)(180/pi) - mosaicity
mosaicity should be smaller than the first term so that delta
phi remains a positive quantity.
If crystal is highly mosaic, oscillation angle(delta phi)
should have been very small while collecting the data. Or else at the time
of processing one has to select a shell of reflections to start indexing
from equation mentioned above.
Rsym and Rmerge, what are the differences?
(May 2001)
I was hoping I could get some clarification on the difference between
Rsym and Rmerge.
Does the Rsym represent the differences in the symmetry-related
reflections on a single image?
or,
Does it represent the differences in the symmetry-related reflections on
a single crystal?
If it is the latter, what about low and high resolution data collections?
Do you report an Rmerge because you are comparing 2 different data sets?
Summary from the enquirer:
Rsym and Rmerge are often used interchangeably. But sometimes they
are not. You need to check the documentation of the particular
program that is giving you numbers or the definition in the paper
you are reading or what the person you are talking to defines it/them as.
Sometimes Rsym is within an image (i.e. MOSFLM Rsym) and sometimes from
reflections within a crystal. Rmerge usually includes these definitions of
Rsym plus any other sources of reflections.
The general consensus seems to be that Rmerge is between datasets (only from different crystals?).
It is still not clear to me when you collect 2 datasets (with differing parameters, for example high
and low resolution) on the same crystal if you should report a Rmerge or Rsym. From the responses
it seems the general standard is that you would still report it as an Rsym.
Two references might shed more light:
- M. S. Weiss and R. Hilgenfeld (1997) J.Appl.Cryst.30, 203-205. On the use of the merging
R factor as a quality indicator for X-ray data
- M. S. Weiss (2001)
J.Appl.Cryst.34,130-135.
Global indicators of X-ray data quality
Water rings, ice rings
(October 2001)
What is the best way to deal with water rings? I seem to remember it was
possible to exclude the relevant resolution ranges in SCALA, but I can't
find the keyword anymore. Or should I exclude the resolution ranges in
Refmac?
Or, perhaps, should I not exclude anything at all because the modern
procedures (maximum likelihood etc) will take better care of it than I
could anyway?
Summary from the enquirer:
XDS (latest version) has a (nice) option of excluding resolution
bins. This way you can always decide for yourself what to exclude and not have a
"black box" tool do it for you.
Reminder: it is MOSFLM in which you can and
always could exclude resolution bins and SCALA could never do this (e.g.
RESOLUTION 15.0 1.5 EXCLUDE 3.79 3.63 EXCLUDE 2.29 2.22 EXCLUDE 1.92 1.90).
Guess my memory was wrong here.
Opinions are divided as to whether to remove data from the ice-rings or whether
it is better to keep the information. Some people claim that maps including the
data from the ice-rings looked better than using data with ice-rings removed.
Perhaps for refinement the data without ice rings is the best, because
the refinement programs will not include missing reflections in the
target. For map calculation, the dataset with water rings may be best,
because a bad estimate for a reflection is better than setting it to
zero.
So I have integrated the data both ways (obviously the statistics
without the rings are better) and will try refining and map calculation
with both datasets and compare the results. By the way, the data is
quite redundant, overall multiplicity 6.0, so really bad outliers should
be taken care of.
Twinning, indexing, re-indexing
Indexing Relationship Table
(March 2001)
I'm currently looking for a table that lists all possible indexing
relationships between two different data sets of the same crystal form if
the true space group symmetry is lower than the lattice symmetry (i.e. true
space group P3, lattice point group 3barm). I don't need this only for my
special case (where I think I've got all possibilities), but I believe this
should be of general interest to all crystallographers who have to get
consistent data sets from the same crystal form (i.e. all searches by trying
different soaking conditions). Of course, the first thing I did was to look
into the International Tables A,B,C, but surprisingly, I didn't find such a
table (or I have eggs on my eyes). Do you know about such a table and could
tell me and the CCP4BB the reference?
Summary from the enquirer:
I've received several pointers to tables with possible
reindexing relationships. Many of them were lying directly in front of me!
Here are the pointers:
- $CHTML/reindexing.html
- XDS indexing routine lists reindexing possibilities
- the HKL manual deals with them in its scalepack scenarios
- It's in the special Acta D issue on data collection and processing,
Dauter (1999),
Acta Cryst. D55, 1703-1717
I222 to P212121
(April 2001)
I have a question not directly related to CCP4 but may be interesting to
most crystallographers. We have a protein crystallized in I222 space
group. The structure was solved by MIR with one molecule per asymmetric
unit. Recently we crystallized the same protein in a very similar
condition, but the space group is P212121. The unit cell dimensions of
the P212121 cell are almost identical to those of I222. So the only
difference is that the reflections with h+k+l=2n+1 are now present!
We thought this is an easy problem that we just need to solve the
structure by molecular replacement methods. But we did not find obvious
solutions. The chance that a protein packs differently but resulting in
exactly the same size of unit cell should be rare! So is it possible
that there are two crystals and one is mis-indexed by one, so the
combination of the two I222 gives a diffraction pattern of P222? Has any
one dealed with this type of problem before, changing of space group but
not unit cell dimensions? What is the explanation?
By the way, the Rsym is quite low (around 5%).
Summary from the enquirer:
The first suggestion was to check if h+k+l=2n+1 reflections in P212121 cell are
weak and do the native Patterson to see if there is a peak closed to
(0.5, 0.5, 0.5). This is to find out if we have a pseudo-I-centered cell.
In our case h+k+l=2n+1 reflections are not weak; they have an
average F of about 10% smaller than that of 2n reflections. However, we
indeed see a strong native Patterson peak at (0.5, 0.5, 0.5) with an
ellipsoid shape but not a perfect sphere like what we observed for the
I222 case. So it is likely that our P222 cell has a pseudo-I symmetry
but (x, y, z) is not translated exactly to (x+0.5, y+0.5, z+0.5).
See the paper describing 3cel:
Stahlberg J, Divne C, Koivula A, Piens K, Claeyssens M, Teeri TT,
Jones TA, Activity studies and crystal structures of catalytically
deficient mutants of cellobiohydrolase I from Trichoderma reesei.
J Mol
Biol 1996 Nov 29;264(2):337-49
A similar example of changing from a I222 (1cel) to a P21212 (3cel) with
the same unit cell dimension was shown. In this case, the
single molecule in I222 is located at (x, y, z) and the two molecules in
P21212 are located at (x, y, z-0.25) and (x-0.5*, y-0.5*, z-0.75). 0.5*
indicates a value closed to 0.5. The translation between the two
molecules in P21212 cell is (0.46, 0.5, 0.5), so it is transformed from
I to P.
In our case, although h+k+l=2n+1 are strong, all the 2n+1 reflections in
the axes are absent. So we thought the new cell is a P212121. But it
turns out that the correct space group is P21212. It is a little bit
more complicated for us, since the 2-fold is along b-axis, so we have to
move it to the c-axis. The result is similar to the cel case that the
two molecules in P21212 is separated by (0.49, 0.52, 0.50) and the
origin of I222 cell is moved to (0, 0, 0.25) in the new but the similar
packing P21212 cell.
Indexing in I222
(May 2001)
Denzo proposed the highest symmetry lattice as I centered orthorhombic
with the skew parameter 0.18%. This gives space groups I222 or I212121.
The predictions in I222 never meet the spots. The unit cell parameters
match almost exactly those of a similar structure of the same protein in the
same space group. So it looks likely. But the misfit is BIIIIIG (30 degrees
in orientation of reciprocal space rows or more, different pattern, even the
spacing a bit bigger).
Anyone has any ideas what to do?
(Except indexing in P1, which is possible, and searching for symmetry)
Summary from the enquirer:
It was a trivial error. I have never tried to force indexing under the proposed
space group, i.e. without cryst. rot and unit cell. Once the autoindexing
is done with I222 forced it works of course.
Tetragonal Twinning & Detwin
(September 2001)
I have a dataset that I scales equally well in P4 and P422. In
order to resolve this ambiguity I looked at the P4 scaled data in HKLVIEW
and found mirror planes in all the right places suggesting that the Laue
class was 4/m mm, therefore P422.
All the moments and intensity statistics in SCALA/TRUNCATE look fine when
the data is scaled in P422, but not quite as good in P4.
Just for the hell of it, I ran the DETWIN program on the P4 scaled data,
and DETWIN reckons my data is pretty much a perfect twin.
So... if the true space group is P422, and you put P4 data through DETWIN,
will it appear twinned (as 'perfectly' twinned P4 data can appear to be
P422...)?
The UCLA twinning
server indicates that my data is not perfectly twinned
when tested in P422...
so now I'm getting two conflicting results and I'm confused...
(basically... is my data twinned or not!!!)
The enquirer kindly provided plots from TRUNCATE (click on thumb-nails to enlarge):
| P4 |
 |
 |
 |
cumulative
intensity
distribution |
1st&3rd moments |
2nd moment |
| P422 |
 |
 |
 |
cumulative
intensity
distribution |
1st&3rd moments |
2nd moment |
Also, have a look at his
webpage on this.
Perhaps packing considerations can help you out with your twinning problem:
In P4 there are 4 a.u. per unit cell, in P422 it would be 8 a.u./unit cell. If
the true space group was P4 and you have a perfect twin, and assume you have one
protein molecule per asym. unit, then when you calculate Matthews parameters for
both P4 and P422, they would look alright for P4 and one molecule, but for P422
you would obtain a reasonable Matthews parameter only for 0.5 molecules per a.u.
The other way around: the wrong assumption of P422 caused by perfect twinning
means that the lattice is too small to accommodate the number of molecules
required by this space group. Think this was what made Luecke et al. suspicious
about the possibility of twinning in the case of bacteriorhodopsin ( Luecke, H.,
Richter, H.T., and Lanyi, J.K. (1998). Proton transfer pathways in
bacteriorhodopsin at 2.3 angstrom resolution.
Science 280, 1934-1937.)
It would become a bit more difficult when the true space group is P4, and you
have 2 molecules in the asym. unit, connected by two-fold NCS. Then you obtain
normal Matthews parameter for the true space group and 2 mol. per asym. unit,
but also for the wrong sp.gr. P422 with 1 mol. per a.u. However, if you are
lucky and the NCS axes do not run parallel to the crystallographic axes, you
should then be able to differentiate between NCS and pseudo-crystallographic
two-fold axes (caused by perfect twinning) by examination of the self rotation
function. The self rotation peaks of data processed in P4 should be at kappa
180, omega 90, and phi _exactly_ at 0°,45°,90° etc. only in the case of perfect
twinning. If they are off 0°, then it is NCS and thus not perfect twinning.
Note from the enquirer:
Unfortunately, I am not that lucky.
I have 2mols per asu in P422 (therefore 4 in P4) - everything SHOULD fit.
My NCS two fold does run parallel to my crystallographic axes, as I have
rather nice looking pseudo-translation peaks on my native patterson...
The DETWIN program indicated a near perfect twin for the P4 scaled data.
As there are no twinning operators for P422, I could not use DETWIN on
this data.
The UCLA twinning server allows you to detect presence of a perfect twin
using your higher space group (for me, P422). The perfect twin test gave a
resounding "NO, you are not twinned!". However, the partial twin test
using P4 data gave a "yes, you are greater than 45% twinned" answer.
Which is right?!
A piece of wisdom: one should always go for the highest symmetry that gives
consistent results.
If the true symmetry is P4, you might be looking at twice as many molecules
in the asymmetric unit, with an 'accidental' packing that looks like P422.
To distinguish between them, you might want to do rigid body refinement of
the P422 derived model in P4 (using the appropriate 422 symmetry operator to
complete the contents of the P4 asymmetric unit), and then observe how far
apart the two are. If there are genuine differences, go for the lower sp.
gr. However, Rigid Body refinement only tells you about gross errors in
positioning the molecules. This might not be significant. So you might have
to go further and do a full refinement in both sp. gr. and observe
particularly the side chains near interfaces that make lattice contacts. A
few of these differences would force a lower symmetry (P4), but if you
assume the higher symmetry (P422) you would not notice in the statistics,
always taking into account the degree of difference (the resolution
obviously has a great deal of impact on the significance of the
differences). 'Accidental' packing that looks like a higher sp.gr. usually
gives a slightly odd N(z) plot in TRUNCATE, where the observed graphs are to
the left of the theoretical ones. If they are to the right of the
theoretical graphs, especially in the bottom left corner, then you should
suspect twinning.
The solution (?):
Following on from my problems regarding tetragonal twinning and
some ambiguity between P4 (twinned) and P422 (non-twinned), we took an
un-scaled MTZ file from a solved/published structure from our college that
was solved in P422 (4/m mm). This integrated MTZ file was in P4.
We then re-indexed this in P422 and repeated SCALA/TRUNCATE/DETWIN
on both P4 and P422 datasets.
Both my data and the solved data scale equally well in P4 and P422
(sensible stats, very few rejections...)
The P4 centric intensity distribution was also a little odd, whereas
the P422 looks fine. All the various moments in P4 and P422 indicated
that the data was not twinned.
Detwin also indicated that, in P4, this data was an almost perfect twin.
The UCLA perfect twinning test for P422 indicated "no twin", but the
partial test in P4 indicated almost perfect twin.
As this structure has been solved to about 2.8A, it is fairly
safe to assume that it is not twinned...
When data scales equally well in both higher and lower space groups,
provided that there are NO indications of twinning in both intensity
distribution AND moments, then is it safe to assume that it isn't twinned,
and it IS the higher symmetry, despite the fact that Twinning tests indicate
that the lower symmetry is almost perfectly twinned? (making us believe that
the higher symmetry is an artifact of the merohedral twinning).... (!)
Therefore, for near perfect twinning, should one pay more
attention to the UCLA "perfect Twinning Test" than other tests designed
for partial twinning?
More thoughts:
The 2-fold NCS parallel to your 4- or 2-fold crystallographic NCS can cause
systematic weakening of some sets of reflections while strengthening others
(depending on whether the pseudo-translationally related molecules scatter in
phase or the other way around). This would result in more weak and more strong
reflections with fewer "average intensity" reflections. Just the opposite of
twinning where you see fewer weak or strong reflections. Your cumulative
intensity distribution plot (the first one) shows such a pattern for the
centrics (black line) which rise quickly (many weak reflections), flattens
off, and then (with a bit of fantasy) rises again at the end. However, in all
cases the line remains below the theoretical line (green) which doesn't make
sense. You also don't see an effect in the acentrics or the P422 curve.
Perhaps it is just bad statistics since you won't have that many centric
reflections in P4 (only the HK0 plane).
Correct me if I'm wrong, but I thought P422 couldn't form merohedral twins as
the unit cell morphology has the same P422 symmetry as its content (unless
your c axis happens to be the same as a and b). For P4 you can have twinning.
Is it possible that the UCLA server with the "higher space group option" is
comparing twin-related reflections in this situation rather than intensity
distributions? If so then of course your P4 processed data suggests 50%
twinning.
Based on your TRUNCATE data I would suggest to go ahead and assume that things
are ok unless you run into a brick wall somewhere. Your parallel NCS and
crystallographic symmetry may turn out to be a greater problem than the
perceived twinning.
Twinning problems (again....)
(October 2001)
The problem is that we appear to be getting twinned crystals, but that
neither TRUNCATE nor the twinning server shows this up. We have tetragonal
crystals, apparent space group P41212 or P43212. The crystals show 100%
incorporation of Se by mass-spec and the fluorescence scan shows a Se edge.
We collected Se-SAD data sets at the peak wavelength for five crystals, all
diffracting to 2.8 - 3.0Å. The data was processed with MOSFLM. Parts of the
SCALA and TRUNCATE logfiles for one are reproduced below. As you can see, the
anomalous R merge is lower than the normal R merge, indicating (as I
understand it) that there is little or no anomalous signal. This (as I also
understand it) indicates twinning and the twinning cancels out any anomalous
signal. The truncate output, though, clearly indicates an
untwinned crystal.
   N 1/resol^2 dmax    Run1    AllRun

   1  0.0128  8.85   0.079   0.079
   2  0.0255  6.26   0.082   0.082
   3  0.0383  5.11   0.082   0.082
   4  0.0511  4.42   0.075   0.075
   5  0.0639  3.96   0.076   0.076
   6  0.0766  3.61   0.078   0.078
   7  0.0894  3.34   0.086   0.086
   8  0.1022  3.13   0.095   0.095
   9  0.1149  2.95   0.111   0.111
  10  0.1275  2.80   0.137   0.137

  Overall            0.082   0.082


  N 1/d^2 Dmin(A) Rfac  Rfull   Rcum  Ranom  Nanom    Av_I   SIGMA I/sigma

  1 0.0128  8.85 0.079  0.060  0.079  0.058    291   18431.  2824.4   6.5
  2 0.0255  6.26 0.082  0.064  0.081  0.048    647   11072.  1877.5   5.9
  3 0.0383  5.11 0.082  0.061  0.081  0.052    877    6824.  1198.3   5.7
  4 0.0511  4.42 0.075  0.060  0.079  0.043   1084    8979.  1406.5   6.4
  5 0.0639  3.96 0.076  0.059  0.079  0.039   1241    6881.  1032.3   6.7
  6 0.0766  3.61 0.078  0.061  0.078  0.040   1383    4751.   740.5   6.4
  7 0.0894  3.34 0.086  0.066  0.079  0.043   1521    2825.   453.7   6.2
  8 0.1022  3.13 0.095  0.074  0.080  0.048   1648    1529.   259.4   5.9
  9 0.1149  2.95 0.111  0.087  0.081  0.054   1744     954.   188.3   5.1
 10 0.1275  2.80 0.137  0.111  0.082  0.061   1826     565.   125.0   4.5

 Overall:        0.082  0.064  0.082  0.046  12262    4432.   955.9   4.6


 Cumulative intensity distribution (Acentric and centric)
         Z   N(Z)Atheor  N(Z)Acen  N(Z)Ctheor  N(Z)Cen

        0.0       0.0       0.0       0.0       0.0
        0.1       9.5       9.8      24.8      25.8
        0.2      18.1      18.8      34.5      35.5
        0.3      25.9      26.9      41.6      41.7
        0.4      33.0      34.0      47.3      47.2
        0.5      39.3      39.9      52.1      52.6
        0.6      45.1      45.8      56.1      56.5
        0.7      50.3      51.2      59.7      59.4
        0.8      55.1      56.0      62.9      61.9
        0.9      59.3      60.1      65.7      64.8
        1.0      63.2      64.0      68.3      67.6
The questions are these:
- Are the crystals twinned, or is there another explanation?
- If so, why doesn't truncate or the twinning server show this?
- Can any useful info about the twinning be gained from the above two
questions?
- Is there any other way of showing the twinning, without the need to
collect anomalous data (because otherwise it is going to be a hard slog
screening to find untwinned crystals)?
- Back to finding another crystal form?
Summary from the enquirer:
The overwhelming majority were of the opinion that the data were not twinned and
that Rano doesn't need to be greater than Rmerge for there to be a signal.
Ranom is the differences between Mn(I+) and Mn(I-) and will decrease as
you increase multiplicity and get better data.
But Rmerge reflects the scatter about a mean and usually increases with
multiplicity - that is why it is a pretty useless measure of data
quality.
A suggestion is the use of XPREP to check the data. This was
actually run on the first set of data that we collected while we were at the
ESRF and it indicated that the data were around 40-50%. This is where the
idea originally got into my head. Initially I discounted this result because
everything else looked OK. But since I haven't been able to solve the
structure with either SOLVE, SnB or SHELXD, I was beginning to think that
maybe XPREP was correct. Can someone tell me where to get hold of XPREP? Is
it only available through Bruker?
Hot off the press: the XPREP analysis will also be available in SCALA
in the new year.
Somebody pointed out that "A trivial (if unpleasant) possible
explanation--the Se-Met residues are all disordered". This is something I had
considered but rejected on the account that there are (meant to be) 10 Se
atoms in the a.s.u.
The Rmerge is quite high
especially in the low resolution bins. This I had noted (and also the rather
low I/sigI) which was part of the reason I think something funny is going on
with the data.
TRUNCATE is for general cases of merohedral twinning.
You can have a variety of other nasty artefacts like hemihedral twinning
and whatever. You could be able to see funny effects in TRUNCATE output
in the table listing h/k/l odd/even intensities. If odd intensities are
less or more than evens that is usually bad news. Hemihedral twinning
can be seen by careful examination of the diffraction images, as double
spots in higher resolution with preference along specific lattice
directions.
With this suggestion, came an example from experience:
We had 3 years of that. A P21 disguised as C2221 which was hemihedrally
twinned P21 at the end (or so I like to think). What worked was getting
actually another protein... If the protein xtallises and shows some
non-standard (merohedral) twinning (which is usually due to a
high-symmetry shape of the molecule) I think it usually means that you
have two separate protein species that interconvert during
crystallisation and can both be incorporated to the lattice, since the
difference is small. In MutS, which is an ATPase, adding ADP together
with cutting 53-c-terminal residues did the trick.
This may be an important clue. The protein involved is mistargetted by
mutants that make the protein temperature sensitive. These switch at around
30°C. So even at 15°C there will probably still be some population of both
forms - enough to screw everything up maybe.
B-factor
B-factor and resolution
(January 2001)
Does any one know if there is any correlation between the overall
B-factor of a structure in relation to its resolution? Are there any
publications on this topic?
Also is there any correlation between the extent of disorder in a
structure and the R-factor/Rfree?
As usual, the B-factor stirs up some controversy.
The first reaction to the question was:
Well, I had a quick look at the data stored in QDB (gjk, acta cryst d52, 842-857) which shows that
for 435 structures the correlation coefficient between resolution and average B is only 0.06,
i.e. insignificant.
The only non-trivial correlate (using a 0.2 cut-off) is the percentage of secondary structure (makes
sort of sense) with cc=0.20.
In my other large-scale test, mentioned a couple of weeks ago, I found that essentially all
temperature-factor-related statistics are "incorrectly" correlated with measures of model
accuracy (e.g., higher average B tends to be accompanied by higher accuracy!). Average B is
very strongly correlated with completeness on the other hand. I suspect that problems with data
and/or restraints (rather than physics) are a major determinant of the temperature factors we
calculate for our models.
Then there was a call to repeat this B-value (Debye Waller factor) analysis with structures
determined from data better than, say, 1.7Å. It is believed that B-values are kind of
fudge factors at resolution lower than maybe 2.5Å, whereas at higher resolution they indeed
make sense, since the restraints are practically downweighted by the X-ray term.
Armed with a quote by Eleanor which was a reaction to a ccp4bb query on 26/27 October 1998:
 > 3. What's the significance of the atomic B-factors when you have a low
 > resolution data, for example, 3.0Å; or 3.5Å.
  Very very little - common sense indicates that if the data peters out at that
 resolution the overall B must be 50 or greater..
 But depending on scaling procedure it can be seriously under-estimated - there
 are several structures in the PDB with swathes of negative Bfactors!
another reader enumerates how the average B-factor may be 'normalized' (or corrupted,
this reader might have called it) during the course of structure determination:
- When putting the data on an absolute scale, a B-factor as well as
scale factor is applied, to make the average B 0 or 20 or some ideal
value (however note the default behaviour of TRUNCATE is to apply the
scale but NOT the B-factor, so some intervention is required to corrupt
the B-factor at this stage). For isomorphous phase determination a
B-factor must be applied to bring all data sets to the same scale,
but it should be applied to the derivatives not the native.
- When making maps to build the model, a negative B-factor (sharpening)
is often applied to enhance high-resolution details. This is well and good,
but the final model should not be refined against this "sharpened" data,
but against the original data.
- During refinement of low-resolution structures, the problem of fixing
scale and B-factors for protein and solvent models may be somewhat
underdetermined, especially when the solvent model is the same as the
protein model (Babinet-type approach used in REFMAC, see
Kostrewa's article in the
September 1997 CCP4 newsletter, and earlier work e.g. Fraser et al. 1978), and
an arbitrary choice of some parameter can make the process more robust.
From the
refmac documentation:
SCALe LSSC FIXBulk SCBulk <scbulk> BBULk <bbulk>
[Lower resolution structures may not have sufficient data to find sensible overall scales and B
values for both the BULK and the protein component. It can help to fix these.]
Suggestions/recommendations from this reader:
- I have the impression that using a mask-based solvent correction as
in CNS the B-factors for solvent and protein can be well determined
at 3 or 4Å resolution. This could be tested by writing out F-part
and F-model and scaling them against the data with ICOEFL, which
prints some statistics about the correlation between terms.
- The correlation of resolution limit with minimum B-factor is
probably better than with average B-factor. There are many
examples of high-resolution structures with disordered loops;
the contribution from the disordered parts would drop out at
low resolution and the resolution limit would be determined
by the best-ordered parts of the structure.
- I recommend a new REMARK card for deposited coordinate files which
would indicate whether the final atomic B's are refined against
original data in an attempt to determine absolute B's, or whether
the overall B is arbitrary and atomic B's should only be used to
see which parts of the structure are relatively well- or dis-ordered.
Another reader suggests that the low correlation between B-factor and
resolution may be partly due to the following: small crystals
collected on an in-house source might diffract only to 3.0Å while
still being well ordered (i.e. low B-fators). From a large crystal
using synchrotron radiation you may be able to reach 2.0Å even though
it has higher B-factors.
The first reader reacts:
To be sure, if factors like size of the crystal and synchrotron source
were far more important than B-factor in determining resolution, the CC
might be negligible. But I think the opposite is the case. First of all
I have a gut feeling that if my lousy crystal diffracts to only 3Å,
dropping the B-overall to 10 would give a greater improvement than
making the crystal 10x bigger or going to the hottest synchrotron
in the world. (Unfortunately dropping the B-overall is the most
difficult approach to take, unless we find a better crystal form.)
Slightly more quantitatively, say B-overall for the structures range
from 10-70. At 2Å, and if I haven't dropped a factor of 2 somewhere,
that makes a 1,808x difference in intensity.
Say scattered intensity is proportional to the number of
ordered electrons in the beam. Going from an 0.1 mm crystal to a
1 mm crystal would give 1000 times the intensity, but I wouldn't
expect such a dramatic improvement in resolution, partly because
much of the background is from scattering by the crystal, and
would increase nearly in proportion. Also that intensity is spread
out over a bigger spot, so peak intensity is increased by a smaller
factor.
Going to a smaller unit cell makes the average spot intensity greater
because that total scattering is divided between fewer reflections.
But the variation in unit cell volume for the majority of
protein crystals is probably less than 100-fold.
Perhaps the hottest synchrotron in the world has 1800 times the
brilliance of an x-ray tube, but I doubt if the signal/noise is
better by that factor.
So I doubt if any of these factors is great enough to completely
overwhelm the effect of crystal order in Gerard's statistics.
but maybe taken altogether? and with other factors I haven't
thought of?
As was pointed out: not all crystallographers use
the same criterion for reporting resolution of a crystal,
which would add further jitter to the relationship.
A number of people indicated that low resolution B-overall shouldn't
be taken literally. That was actually my main point, then I wanted
to ask "can we do better?" or should we acknowledge that fact in
a REMARK that will warn the non-crystallographer against using the
B-factor as a criterion of structure quality when comparing
low-resolution structures? (OK- maybe non-crystallographers pay no
attention to B-factors and even less to REMARK statements).
Summary from the enquirer:
To summarize, many of you believe that there is a (good) correlation
between the overall B-factor
and the resolution cutoff. But then Gerard's statistics showed
otherwise. Some of you attributed this observation to the correlation
being masked by effects of experimental limitations.
Anisotropic ellipsoids
(March 2001)
According to many textbooks the first three of the thermal parameters
U11 U22 U33 U12 U13 and U23 describe the displacements along the
perpendicular principal axis of the ellipsoid and the latter three give
the orientation of the principal axes with respect to the unit cell axes.
However, I can't find anywhere how U12 U13 and U23 (apparently as
direction cosini) exactly describe the orientation of the ellipsoid, say
in a cartesian system.
Any hint is appreciated (but don't suggest to try to follow the ortep
code)...
Summary from the enquirer:
First of all, my question was based on the false assumption that U11, U22 and
U33 are the components along the principal axes of the ellipsoid. The text on
page 533 of Glusker et al. "Crystal structure analysis for chemists and
biologists" led me to that conclusion, although the example on page 536
indicates that things are not as simple as that. U11, U22 and U33 are the
<u2> values along the reciprocal cell axes a*, b* and c*, respectively
(e.g. Drenth, page 94).
The principal axes of the thermal ellipsoid can be obtained from the U values
via a principal axes transformation. This is described e.g. in Giacovazzo et
al., p. 75 ff. and 148 (don't rely on the index), in the ORTEP manual, International
Tables Vol.II p.327, and $CLIBS/rwbrook.f
For the full summary, including equations, see
the CCP4BB archive
version of this posting.
Movies and other picturesque queries
Structural Transition
(January 2001)
Is there a program that can make a movie of a protein structural
transition, given a "start" and an "end" conformation of the same
protein?
We have determined two very different structures of one protein domain,
and would like to present the structural transition in a reasonable way.
Going from one structure to the other may involve unfolding part of the
protein and refold it. Such a big conformational change is difficult to
model, therefore, a program with some level of automation would be really
helpful.
- You can do that with LSQMAN, see:
mol_morph.html.
For an alternative, see:
MolMovDB.
- I recently did a fairly complex cartesian-space interpolation between
multiple structures with different numbers and types of atoms using
OpenDX. This may be of use if, for example, you find
that a covalently-bound oxygen is replaced by a crystallographic water and you want to
animate the change. We also animated movements in crystallographic
waters. The process was tedious, but could be done. I suspect lsqman is
an easier solution in cases where you are only interested in conformational
changes of a single structure rather than chemical changes.
Another alternative is to use Ron Elber's method of finding
paths of minimum energy on the potential surface by minimizing
an unusual action functional. You can specify starting and ending
states and in initial guess for the path (often a line). This method
takes you a step beyond LSQMAN in that an empirical forcefield is used.
You should be able to get the code from Ron through the
NCRR at Cornell.
Summary from the enquirer:
The morph server at Yale seems to be easier to use. However, I had some
trouble getting results, probably due to the fact that some serious
unfolding is involved in my case. The authors have been notified about the
problem and hopefully they are trying to fix it. Haven't tried other
programs yet. As a word of caution: this kind of "movie" will need
more justification as to its biological relevance. Our purpose of making
such a movie is just to show the magnitude of the structural changes.
Digital Imaging of Crystals
(May 2001)
I would like to purchase a system to record images of crystals
electronically. If anyone has come up with a relatively cheap method of
doing this, I would be grateful if they could share their experiences. I
guess the cheapest way is to stick a digital camera on your microscope - we
already have the adaptor for a regular SLR camera. However, I would also
like to hear about other, perhaps more sophisticated solutions.
Then, after a few days, this was added:
In the light of some of the responses I should have qualified it by saying I
wanted a system that gave me an instant result. I didn't want to record a
whole tray automatically, just the ones with crystals. Neither did I have a
requirement for sophisticated annotation features. I just wanted to be able
to transfer the images easily to a PC.
Summary:
- Olympus is offering a rather
sophisticated solution for a digital
camera. You can catch that signal 'live' via the analog output of the
camera at low resolution (around 600x400) and you can also take stills in
high resolution 2048x1536. You have to buy the camera (~2000 Euro) the
frame grabber for the PC (~500 Euro) - the PC obviously - and some
software from Olympus (which IS necessary to combine the live and
still-high-quality capabilities) which is another ~1500 Euro.
The alternative we chose (again from Olympus) was to buy from them a JVC
camera for ~1800 Euro for live image and use the frame grabber to save
images. The quality of that is not outstanding - by any means - but good
enough even for publication in small size - i.e. single column Acta D.
Some free-ware framegrabbers (e.g.
IrfanView) have capabilities for time
lapse photography. Together with a real 'cold-light' source it can be
fun and educational to take pictures of crystals growing.
Another solution is the Pixera cameras
which have some cheaper models
which are fine. You can buy these from Olympus as well or directly from
Pixera. Olympus will be slightly more expensive, but then they gurantee
that the whole boogie works.
- A much cheaper option would be to use a flat-bed scanner (no need to spend
more than 50-100GBP; if you want to scan 35mm slides as well you can buy an adaptor
for many scanners for an extra 30-50 GBP) to scan photographs of your crystals
taken with your film SLR. Of course, you'd still have the running costs of film,
and delays in processing etc...
A reaction to this suggestion:
If I might respectfully disagree here, flat bed scanners are
often extremely poor negative/slide scanners. They are especially
atrocious for slides. Much better to get a slide/negative scanner (HP,
Canon, Nikon, Minolta, Poloroid all make respectible models), e.g. the
HP Photosmart S20
gets good reviews. There's a fair amount of www info out
there on the "digital darkroom" if you want to go that route.
The response was:
No need to be respectful about it - I haven't tried the slide/negative
adaptors so can't make any comment about their quality! However, I note
that the US price of the Photosmart S20 is $499, which is rather higher
than the cost of the slide adaptors I suggested.
You pays your money and you takes your choice...
- We bought a
Nikon Coolpix950
last year with an adaptor (sold by Nikon) to
our Nikon microscope and we are very happy with its performance. It
records the pictures on a flashram card which can easily and fast be
transferred to a computer with an USB port. This is much cheaper than
special high-end digital cameras for microscopes but my feeling is that it
is more than enough for our purposes, with the additional advantage that
it can be used as a normal digital camera as well if you want to document
something in the lab. We also use it for PAGE gels etc.
- There are several alternatives:
- CrystalScore from
Diversified Scientific, Inc. is one option.
They have an automated stage and can take one complete set of pics from a crystal plate.
- Emerald Biostructures
also sells a good digital camera for a microscope, and a notebook system for recording and
annotation the images (note from mgwt: but their website isn't really in English...).
The basic issues are what are you going to do with the images. Do you want
to save them all, or just one or two from a crystallization run, or
time-elapsed images.
The easiest thing to do is get a good digital camera for the microscope,
take the image, and use photoshop, or some other application like it to modify
and store the image. Good digital images are about 1MB in size, with enough
resolution to zoom in after the image is collected.
If you are talking about saving an entire set of images from a crystal plate,
it's more complicated, since you have to worry about where the drop is, the zoom
level, focussing, etc.
- I have a video camera (#700) attached to my microscope (Leica) which
is attached to a Matrox video card (#800) on a PC. The system works
reasonably well, and I can capture images to put into Powerpoint
presentations, and also for archiving crystallization tray results.
The system is about 4 years old. I think video cameras cost about
the same, but video capture cards have come down in price a lot.
I am told that the quality of the picture I get in the monitor is pretty
good and much better than the system set up at the MRC (Cambridge).
I got my information about video capture from the microscope
representatives when I bought my microscope. They are of course
interested in selling the most expensive high quality system, but
if pressed they will offer cheaper alternatives. This is what I did.
The risk I had was the unknown quality of the captured image when
I bought the hardware. But I think it is pretty good for almost
everything I want to use the images for.
- We bought a Pixera
camera about 3 years ago....primarily because
it was so afforable (~$1200 at the time which was quite good then).
We still use it, but the old adage is definately true: you get what you
pay for. It is slow and the quality is pretty good at low magnification
(on the scope) for "macroscopic" objects, but when you get down to
the level of most typical protein crystals (100 microns or less), it
doesn't do such a fabulous job. Also, it's purely a manual setup -
no options for auto-scanning trays or dropping all of the images into
a database or anything like that. I can forward a representative
image if you're at all interested......
On the flip side, I know several people who have bought the digital
microscope cameras from Kodak - there the quality is much higher, but
I understand that it is also much more difficult to use - the images
are stored on the camera until you manually download them to a computer.
The Pixera at least works through a card that you plug into your computer
and images are dropped directly to disk.
- Birdwatchers have been doing something analogous for a while - taking
digital pictures from the optics of their (rather high quality) telescopes
("digiscoping"). With digiscoping, often the simple expedient of putting
the digital camera up to the eyepiece and taking the picture will work.
Some tinkering with focus is sometimes necessary. The digital camera's
picture review facility makes life easier.
See: digiscoping
as an example. The pictures are surprisingly high quality.
I am guessing that the same approach will work with microscopes as with
telescopes since the optical designs are closely related.
- What we did is similar to what you have, but instead of taking the images
with an "off the shelf" digital camera, we purchased a ccd chip, a
focusing lense and an electronic board. After assembling the components,
we mounted it on a C-mount. We connected the output terminals to a
computer and to a small TV. The TV is used for oberserving the crystals
and the computer is used for capturing and storage. You can use the
computer for observing as well and not need the TV of course.
We also connected a printer to the TV so that a low quality hard copy can
be printed without going through the computer.
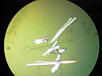
Our students found that you can take any digital camara (ie one meant for
photographing scenery on vacation), hold it just so over the microscope
eyepiece, and shoot quite nice pictures. If you make a little cardboard
adaptor tube that fits over the eyepiece, its even easier. The preview
thingy on the back of the camara is crucial.
The attached pic was taken with a Canon PowerShot A5 (click to enlarge). |
 |
- I am very happy with our
Olympus AX70
Digital microscopy system. It has the
Olympix 2000
digital camera on it, and DIC optics. I admit, maybe it was a leetle bit pricey....
I would suggest also getting the lowest power objective available -
sometimes I grow crystals that are too big to photograph!
For crystals grown under oil, you might wish to purchase an inverted
scope.
- If you're tending toward the high end, I suggest looking into a robotic
microscope stage and crystal tray manipulator so you can give it a
stack of 12 trays and have it take a picture of each well at 0, 1, 6,
12, 24 hr, and daily thereafter; without the necessity of some human coming
into the cold room and breathing moist air all over the lenses. Then
if you solve the structure from the coffin-shaped crystal in well C5
of tray 7, you can go back and make a time-lapse movie of the growth of
that crystal to show in you powerpoint presentation.
And get Emerald or Hampton to mass-produce the system and sell it for
under $10k so we can all get one.
On the low end you can get adaptors to put an inexpensive ccd video camera
on the same port used by the film camera, and something like Connectix
"Quick clip" device to grab video or still images from the video stream.
Resolution is lousy, but if you zoom in till the crystal fills the view
it's not that bad. Pixera has a digital video system with the same
functionality but refresh rate is much slower than video making it
difficult to focus (at least on slow PC's).
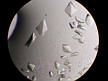
I use a Nikon system. An adapter arm fits between the lens and binoculars.
You can then place a threaded mount on top of the adapter and screw on your
digital camera. I use the Nikon Coolpix 990 which runs about $1000. But you can
use any digital with a threaded lens mount.
Attached a picture of crystals that I took with the system (click to enlarge). |
 |
- Our cheap trick is to use the little ccd camera that SG gave away with
indies a few years ago.
Image production
(June 2001)
I'm preparing some color images for structure paper submission. However, there
is still not satisfactory solution for producing images of required resolution.
Any image cropped by snapshot on the SGI work stations only has a resolution of 72 dpi,
making it unrealistic for further processing or direct submission. Trial-and-error
photography of these images displayed on the screen using the best film-loaded or
digital camaras suffers a lot from the over-saturation of local white regions and the
white margins of imgview or imgworks, and terrible distortion of the image by the screen.
Could any person give me some tips about this issue?
Some more detail was added after a few days:
Thanks for those who have responded to my problem. Before I could report a summary
about this issue here, I wish I could have a chance to go into some specific details about
my problems.
GRASP: Grasp would produce nice .ps files. However, for purpose of further processing,
such as for labeling charged residues, I have to outport it from SGI to Adobe Photoshop in
PC. Since I don't know any img-format (from .ps to .tiff, for example) conversion programs
in SGI, I have to use 'snapshot'. Suggestions of using gimp or imagemagick for format conversion
have led us to download the programs. But the installation of gimp failed. It complained that
'the gtk-config script installed by GTK could not be found', although we've installed the
glib-1.2.8.tar.gz (obtained from The GIMP Toolkit)
beforehand. Please look at the log file
and I wish somebody could help me out with this. Imagemagick seems to need more
other things.
Stereo-pair electron density map superimposed with structure model: O is exhaustedly used
for model building, but for image production Turbo-Frodo seems to achieve more brilliant
color and much better ball-and-stick model, and is able to produce stereo pairs (although
they will crossover at the middle). Sometimes the feature of Van der Vaals surface presentation
in Turbo could be a simple reason why using it. In such case, snapshot seems to be the only way
of catching the images. I've been advised to use Bobscript and am lucky enough to obtain it
today (I wish it will help soon). But still, is there any other program
producing good VDW surface images?
Program Molscript and Raster3D have been running on our SGIs. Stereo-pairs production by
Raster3d needs tiff library. However, we have real trouble in installing the tiff library.
This make the production of stereo pairs with Raster3d impossible. We're using SGI O2
(Irix 6.5 operating system). We've downloaded the tiff software from
TIFF Software
(file:
tiff-v3.5.6-beta.tar.gz),
but failed in compilation (there seem to be many errors, see
log file). Have I got the right thing, please?
It seems that if these two problems could be solved, I would be able to find my way out.
Summary:
Some tips and hints:
How to control the size of .ps files in NPO
(June 2001)
Here I have a chance to ask for help to a problem with the old command-line ccp4
version at a brandnew era of ccp4i.
Year ago I produced some patterson maps for heavy atom harker peaks in P212121 space group.
The ps file is fine when printed out, but when viewed with xpsview, the top portion is
missing! Today I try to convert it to pdf format using acrobat distiller, the top portion
in the pdf file is still missing.
I'm thinking of aligning different sections up so as to have a nice view of the heavy atom
sites. Of cause, printing the images out and then scanning them back to computer is a way
out. But it is really a clumsy one.
I'm attaching the input file and one of the problematic ps file here, wish anybody could
give me a shortcut. In fact, I could not find a control line to specify the image site in
npo. Would it be possible for me to get the control by modification of the ASCII ps file?
Here are the NPO script and the
NPO postscript file (which may be saved
and viewed with your favourite postscriptviewer).
Most suggestions are directly related to editing the ps file:
- The bounding box in the postscript file is wrong. If you have ghostscript up-and-running do a
gs -sDEVICE=bbox nposize-jun2001.bin
to get the right bounding box and change the corresponding entry in the
postscript file (%%BoundingBox: and %%PageBoundingBox:).
- Replace the line that says
%%BoundingBox: 0 0 365 800
with the followin three lines
%%Orientation: Portrait
%%DocumentMedia: A4 596 842
%%BoundingBox: 18 18 578 824
- Insert a scale command in the postscript file at the end of the postscript
file header. E.g. to scale both x and y by 0.5 add "0.5 0.5 scale"
%%EndProlog
%%Page: 1 1
%%PageBoundingBox: 0 0 365 800
0.5 0.5 scale
- Have you tried using ghostview instead of xpsview? The file looks fine
when I look at it in ghostview. I think xpsview is broken with respect to large bounding boxes.
Distiller may be too.
Failing that, add the line:
0.5 0.5 scale
as line 14 of the ps file.
- I used Illustrator running under classic running under osx and the file opened without a
hitch. I exported it to a jpg file in rgb color mode with standard compression. Hence it is
not your file but your programs that are to blame.
(note from mgwt: I tried ghostview, presumably the same version as in suggestion 4 as I'm in the
same lab, and for me it did not display the top part. What did work for me, was to use
xv.)
Movies for powerpoint
(July 2001)
I thought someone had recently enquired about how to make movies of
rotating structures for importing into PowerPoint. I've searched the ccp4
archives but can't find the Q/A.
So, what programs do people use to do this?
Stereo figure from molscript
(August 2001)
Is there an easy way to generate a stereo figure from molscript?
I couldn't find anything in the documentation.
Summary from the enquirer:
- Just use the same input file and add "rotate y -6.0" to the transformation
to generate the right hand figure. I've also used -8° myself. You can also
rotate the left image by +3.0 and the right image by -3.0 relative to the
orientation you have worked so hard to obtain.
Alternatively the
Bobscript distribution
includes, or at least has included, a jiffy script to do this automatically.
- Create an r3d output file with molscript. Render the r3d file with the
stereo option in raster3d.
How to generate postscript files, and how to achieve the
correct resolution
(January 2001)
I am using Bobscript to generate image files with electron densitiy maps. Is it
possible to save them in postcript format?
If this is not possible what is the best way to submit rgb files to publication??
Bobscript outputs postscript files by default (without any flags), i.e.
bobscript &lgt; input.inp > output.ps.
Also, you can put labels etc. within Bobscript itself; no need to take it
elsewhere for that purpose. The area command on top of the file can set
the exact size of the output for printing or including in any documents. To help
with this, there is a grid (in the O distribution):
edit.ps.
Usage: print or copy onto an overhead, overlay on your plot and
read off postscript coordinates.
Displaying a file with `ghostview' or `gv' and reading the mouse
coordinates is another easy way to determine PostScript coordinates.
The preferred format(s) is (are) in most cases explicitely mentioned in the
instructions for authors. Most journals will like TIFF and EPS.
On a related issue:
If a journal requests 400 dpi (dots per inch) pictures
and you plan the reproduction (print) size to be
i.e. 8x4 inches, that means that you need 3200 dots
on x and 1600 dots (pixels) on y.
So if you make an RGB or TIFF
file make sure it is 3200x1600 pixels in the first place.
Importing a standard 'render' output of 1200x1200 pixels
and then 'set resolution to 400 dpi' in Photoshop
is not nearly a cure for good quality pictures ...
..... and, talking about photoshop:
Do not forget that TheGimp is out there!
'Hardware' (and some Software)
Oils and cryo-protection
(January 2001)
This started off as a question about low-temperature data collection:
How do you collect a low-temperature dataset with a deoxyhemoglobin crystal without
exposing the crystal to atmospheric air?
The discussion evolved into one about oils used for cryo-protection.
Summary from a helpful bulletin board member:
It is clear from the
responses that oil is no panacea, but it seems to work very well
in many cases. We've had good luck so far, but organic solvents
in the drop may pose problems. We do see diffuse scattering due to Si,
but not enough to be concerned. Some suggest drying the oil as an
aid in removing the water layer on the surface of the crystal. We suspect
technique is very important here, and oil composition less important.
We tried a silcone-based diffusion pump oil from Dow (750).
It is thermally stable and claims to be radiation and oxidation resistant.
References:
- S. Parkin and H. Hope,
J. Appl. Cryst.
(1998) pp945-953
Section 2.1 of this paper recommends Paratone-N, possibly saturated
with water. Recommends against Si- or F-containing oils due to
higher scattering power. Half the xtals they have tried survive oil
treatment. Main problems are mechanical strength, loss of water by xtal
resulting in cracks, or difficulty removing water layer. They are
advocates of quick-dunk cryoprotection when oil does not work.
- H. Hope, Annu. Rev. Biophys. Chem. 1990 19:107-126
More details of oil/cryo handling (covering hanging drop with oil
and dragging xtal through oil-water phase, wicking etc.)
- Riboldi-Tunnicliffe and Hilgenfeld,
J. Appl. Cryst.
(1999) 32, 1003-1005
- "The structures of deoxy human haemoglobin and the mutant Hb Tyrosine a42->His at 120K"
Tame and Vallone,
Acta Cryst D56, 805-811
It is possible to protect the crystals from oxygen using dithionite,
at least long enough to cryo-cool them.
Then some accounts from users, both positive and negative:
Using oil is an excellent method and has been used for many years by small
molecule crystallographers for freezing extremely air-sensitive crystals.
I've used it successfully with macromolecular crystals too.
I've used a perfluoropolyether oil for this (used to be Riedel-de-Hahn
RS3000, but this hasn't been manufactured for many years. I haven't needed
any since '95 so haven't looked into it seriously, but new sources have
been discussed on this BB in the last year or so).
For the small molecule case, it works by providing a physical barrier -
the amount of oxygen that can diffuse through the oil is actually quite
small. Also, something I didn't mention before - most air-sensitive
compounds are actually sensitive towards hydrolysis, so it isn't the
oxygen that reacts directly with them. Water, of course, is not terribly
soluble in perfluoropolyethers. However, nothing which isn't pfpe is
soluble in pfpe oils.
For macromolecules, it stops evaporation of water from the crystal, giving
you time to cool to create a vitreous phase. But the migration of oxygen
through the oil is also limited, so that helps too.
We have used MO (mineral oil) only occasionally and with indifferent results.
that is, sometimes we get useful freezing but never better
diffraction. We purchased a 'panjelly kit' and tried their
suggested protocols. Nothing (including
lysozyme) diffracted any better than we had obtained by
conventional means and in no way did we find any help
annealing crystals. Add to this that the stuff does
not perform well in the cold room we let it languish on the
shelf for some months.
I tried 3 different oils and their mixtures - all successful so far and now I always
use it by default. The first oil was the machine oil from the workshop, the latest -
Paratone N. No special preparations were required.
Our laboratory has used oil, in place of a cryprotectant, for cubic lipid
phase bacteriorhodopsin crystals successfully...
We've tried oil once so far, on crystals of a rather
large protein-DNA complex grown from Ammonium sulphate. At room T, they
diffracted to 13Å, and frozen in propane, 13Å, but the ones we tried in oil
didn't yield a single spot (at a synchrotron). (And we did have help from
someone who swears by oil).
Now granted, these crystals seem to be useless no matter what we do, but
oil-freezing certainly didn't improve things!
The oil method has worked very well with four different crystals in my
hands, and it is now the first thing I try. It decreased mosaicity with
regard to other cryos in one case, and proved essential in freezing one
extremely fragile crystal without damaging it. The other advantage I find
is that you do not need a artificial mother liquor. I have also had one
crystal that it did not work with, so it is not always a sure thing. I
have a feeling that in that latter case it may have had something to due
with high solvent content. Briefly the technique I employ is as follows
(for hanging drops):
- cover the drop on the coverslip with a small amount of oil (20-40 ul).
When I first read of this technique, I was eager to try it a a troublesome
crystal and actually used fresh vacuum pump oil. it worked like a charm,
and I have used it since with no trouble.
- with a loop, fish the crystal out. I like to use a loop smaller than
the crystal (spoon it). I get less of the mother liquor sticking
to the crystal/loop that way. I also find that it is not to difficult to
ge rid of any risidual mother liquor by passing the crystal back and forth
through the mother liquor/oil interface. I had trouble with this and
loops big enough to hold the entire crystal. The oil "glues" the crystal
to the loop.
- plunge in liguid N2 or freeze in a stream. I usually plunge myself.
Oils are great. We use perfluoropolyether,
paratone-N, and 75:25 or 50:50 paratone-N:mineral oil. At least in one
case where 100% paratone-N cracks the crystals, the 75:25 mixture worked.
I frequently use oils when using high salt precipitants as the phase
difference traps the salt in the crystal and stops diffusion between the
cryo protectant and the crystal.
I have found it usually works for most high salt crystals and some PEG
grown crystals as well.
The problem is the oils diffract and give diffraction rings.
I have always found parrafin oil (Hampton) works fine. It gives rings at ~4
and 2.3Å so a normal data set has only two rings. The rings are usually
quite small so I don't loose much data.
If it wasn't for the rings I'd use oil as first choise as it usually works
first time and therefore saves time fiddeling with cryoconditions.
Recently I got three to work from: 4M NaFormate, 2.5M A.S. and 24%PEG grown
crystals
System backup devices
(February 2001)
How does everybody out there do their SYSTEM backups (SGI)?
This question is related to a little discussion a few weeks
ago on LINUX backups. Right now I am not doing any. scary
..... so I figure I'll have to buy something.
- CD is out of the question, I guess. I figure I would need
quite a few CDs to backup our 6 Gbyte hard discs.
Plus some other machine to do the backup on, since on the
fly burning seems somewhat risky? CDs work great for our MAR
datasets, though.
- DVD is not quite there yet, as I understand. Also, would it be
synchrotron trip compatible? Prob. not? Would it have to be?
I guess CDROM is good enough for that. Would DVD hold a full
backup? Don't think so (only 4.8 Gbyte).
- Leaves us with tape. I thought of some DAT DDS-3 system
as a compromise for now. DDS-4 is a bit spendy still.
same for Exabyte Mammoth (or so ...)
Summary from the enquirer:
The *s denote the number of people mentioning the
respective devices:
general
- One user found that tapes (in general) are not reliable for long
term storage, but should be OK for backups (*)
- One user pointed out transtec
for good prices on DDS-4 systems. This company has websites in various
countries (check out the bottom of the first page). (*)
about different media
- DLT tape is highly praised, albeit expensive (***)
- DAT (at least the older ones) was reported to be problematic
from the hardware side (break-down of tape drive and frequent cleaning
required) (**)
Seems like other people have been content with DDS-3 and DDS-4 (**)
- An Ecrix VXA (Ecrix) system was reported
to be relatively cheap (as compared to Mammoth) and very dependable (*)
- One user is in the process of switching everything over to
a backup server, doing all the backups via ethernet on an array of
80Gbyte hard discs. Thanks for re-emphasizing the difference
between backup and archiving! (*)
Dry shipper container
(March 2001)
We recently purchased a Taylor-Wharton LN2 dry shipper dewar (cp-100)
but are having trouble getting the outer shipping container that houses
the dewar. Is there, by any chance, another company that makes these
containers?
Summary from the enquirer:
The company no longer makes the
hard plastic outer container; this has been replaced with a much
cheaper, somewhat reusable cardboard container. I suppose this is why
our local representatives got nowhere with T&W when trying to ask for
the plastic box.
Crystal growing cabinets and crystallisation incubators
(May 2001)
Does anyone have references/makers of
crystal growing cabinets capable of covering a temperature range of 4-40
degrees C? Also, does anyone have any experience to report using the Mini-T
product from
Diversified Scientific Inc.?
Not long after that, a similar question:
Slightly off the topic but can you recommend crystallization
incubators for 0 - 50 (90) degrees C, 50 to 100 Litres?
Summary from enquirer1:
Several refrigerated incubators
(Revco BOD,
Fisher Precision,
EJS Systems, Inc.)
have had reported temperature problems. At least one group has gone to the
trouble of making its own temperature programmable crystallisation boxes
(Personal
crystallisation boxes) which might be available
semi-commercially. The consensus (3/10 replies) appears to be that the
Hampton M6 incubators
covering a range of 4-60 degrees are the most
dependable. The down side is these can only hold 6 Linbro trays.
Summary from enquirer2:
- We have an incubator made by VWR, model 1525, part 9120833. It spans the temperature range
you mention, however I am not sure of the volume. If you would like me to measure it in order
to calculate the volume, please let me know. Website:
VWR Scientific Products.
This is not a cooled incubator even if the company produces such machines.
- I bought two such incubators from
Molecular Dimensions,
61-63 Dudley Street,
Luton, Beds LU2 0NP,
Tel: 01582 481884
Fax: 01582 481895
Their Web site: Molecular Dimensions Ltd
These incubators are good, reliable and vibration free as well.
- We have incubators manufactured by ehret.
Good price and with suspended motors (vibration free).
Website: EHRET.
Replating anodes
(August 2001)
We have a target from a Rigaku rotating anode generator where the copper is
badly etched, so we can't use it. Has anyone ever had a target replated?
Anyone done it themselves?
Summary from the enquirer:
I asked about repairing a damaged target in our Rigaku rotating anode
X-ray generator, and received many helpful responses. First I should
clarify the problem. The target in question has a deep groove, probably
caused by a combination of a cooling problem and having the bias set too
high.
From the responses, the standard dogma is polish, machine, or replace
(re-cup), depending on the severity of the damage.
There were several suggestions as to how copper might be added,
sputtering and electroplating, but no one reported actually trying these
methods. There was one suggestion that the target may not be pure
copper, and if true, then adding metal by electroplating is not
possible (I don't know about sputtering).
I've got a call in to MSC/Rigaku and I'll see what info and prices I can
get from them. Regardless, I think I will try to electroplate the one I
have. It is too badly grooved to polish or machine, so what have I got
to lose? I'll report back on how it goes.
Physical models
(May 2001)
Some people in my group seem to vaguely recall a way to have a plastic or
rubber space-filled model made from a pdb file for ornamental or display
purposes. Does anyone know of a company that does this type of thing?
- A company called Z Corporation makes a machine
that casts models of a hardened resin from VRML files.
- I don't know if it's what you're thinking of, but the visualization group
at SDSC has a laminated object manufacturing facility that can construct a
model of a solvent accessible surface from layers of paper. The result of
the process is a model that looks and feels like it's carved out
of wood. They also have a similar machine that can produce plastic models
that can be translucent or opaque, but I'm less sure of how that works.
See NPACI & SDSC Visualization Lab and
Tele-Manufacturing Facility Research Project
for more details and
some photos and explanation. They definitely don't run a mass production
facility, nor a novelty factory, since it's a fairly expensive machine to
run, but if you've got a "genuine scientific reason" for wanting such a
model, they might be willing to make one as a one-off.
Dynamic light scattering
Interpreting DLS - discrete dimer vs. random assembly
(January 2001)
I'm running dynamic light scattering (DynaPro99) and am
wondering how to interpret what I'm looking at. If any
experts out there, I'd appreciate any input.
Scenario:
I have a protein where the active form and a previous
xtal form both are homo-dimers (45kDa monomer). Previous
xtal conditions were not screened for DLS. I observe
the protein as a sharp monomer DLS peak in the storage
buffer and as a BROAD DLS peak centered around 500kDa
in the previously successful xtallization conditions
(this is the same protein that gave xtals, but 2 months
later).
I can decrease the precipitant concentration to a point
where I find a slightly-less-broad DLS peak centered
around 100kDa... which could correspond to the dimer...
or to the average MW of a random distribution of monomers
and small-ish agregates.
My thinking is that it's the small-ish aggregate option.
My thinking is that if it were the active dimer form,
the distribution would be just as sharp as the monomer
distribution in storage buffer.
I'm wondering if anyone has any rule of thumb about how
sharp a peak needs to be to call the solution homogeneous?
Summary from the enquirer:
Concensus answers:
- Look at the errors: if they are large, redo the experiment.
- Look at the polydispersion index:
This is the percentage obtained by dividing the dispersity
of your peak (how broad it is) by the hydrodynamic radius.
If it is less than 0.1 your solution is monodisperse.
Some people went as high as 0.15 to say it is monodisperse.
Above 30% is a polydisperse solution.
- Look at the bi-modal distribution:
If the polydispersion index is larger than 0.1, the bi-modal
distribution can sometimes tell you if there is a high MW
aggregate that is contributing to the scattering. The % of
each component is listed.
- Notes on applying info data to crystallisation:
- The peak will always come to a higher MW than the true
MW, unless your protein is a perfect sphere, due to
unaccounted for additional rotation friction.
- A protein does have higher chances to crystallise if it is
monodisperse (which is not saying it will crystallise),
but a low level polydispersity (2% or less) of aggregation
in most cases did not make a difference.
- Linked to
Habel et al.,
Acta D57, 254-259:
On several occasions it has been possible to crystallise solutions with a
Cp/Rh (polydispersion index) of 20-25%.
N.B.: contrary to the information in one of the postings in this
discussion, Protein Solutions Inc no longer provides a message board on its
website.
Filters for DLS measurements
(October 2001)
Which filter size do you normally use to prepare protein solutions for
dynamic light scattering measurements? Is it really necessary to take 0.02
micrometer filters as recommended by ProteinSolutions and found in many
papers, or are 0.2 or 0.1 micrometer filters also reliable?
In our lab some people made good experiences with 0.2 micron filters. In one
case good DLS data (monodisperse solution) and excellent and reproducible
crystals afterwards were obtained. However after filtering the same protein
solution with 0.02 micron filters the protein was apparently away. At least
no DLS signal could be detected any more. Normally this observation itself
could be interpretated as an indication of aggregation, but the
crystallization results do not support this idea.
So is it generally legitimate to swap to 0.2 micron filters if 0.02 micron
filters catch away the protein? How are your experiences?
Summary from the enquirer - experiences from others:
- I was using 0.2 um spin-filters (I think they came from Eppendorf) when I ran out of the 0.02 um
filters, and the results were alright. Normally, we are using the MicroFilters from Hampton
without loss of protein. I would assume that if you loose protein, it's because the protein sticks
to the membrane, in which case centrifugation might be a better way to get rid of aggregates in
the first place.
- I have used 0.2 micron filters for DLS with no apparent problems.One of the original papers
describing this method (Methods in Enzymology Vol. 276 p.157 by Ferre-D'Amare and Burley)
use 200 Angstrom pore size ...
Also, you should probably check your filtered sample another way to make sure that your
protein is being trapped and nothing weirder is going on. Run a gel orUV-Vis spectra ??
- I regularly use a 0.1um filter to filter protein prior to DLS. I use the centrifugal filter from
Millipore as this has no dead volume it doesn't waste your precious protein.
- I've found the smaller size filters (0.02) more difficult to use reliably. They seem to break or
leak easily under modest pressure. In some cases, however, they seem to be necessary. I always
try a larger filter first. With some practice you can recover most of the protein only slightly
diluted and filter again with a finer mesh if need be.
- I normally start with 0.2 micron filters and work my way down if needed. As you indicated,
sometimes you catch away all the protein which is indicative of lots of small aggregates. You
will not be able to make good measurements from these whether you filter or not. You are wrong
however to assume that aggregates and crystal gowth are incompatible!
- The folks at Prot.-Sol. say you can sometimes get away without filtering if you spin the
sample first.
- We never filter our samples prior to DLS. Instead we centrifuge them in a benchtop centrifuge
at maximum speed (the same as we would treat any sample prior to crystallisation). We were
actually shown this by the Protein Solutions rep who visited our lab. We have had no problem
analysing our samples after treating them this way.
- The golden question here is the size of your protein. If it is too big to go through 0.02 micron
filters, you won't see a DLS signal. There is no protein in the solution. The protein is in the filter.
Here I do not mean the unit-cell dimensions or contents of the asymmetric unit, but really truly
monodisperse particle sizes in solution. That's where the answer is. Find out the true
aggregation state of your protein, then you know what size filter cut-off to use.
RedHat7*
(June 2001)
I don't know how many others of you received a similar email from redhat,
informing us that the compilers shipped with redhat7.1 were broken - so what's news?!
Anyhow I have updated my Redhat _7.0_ system to use the new compiler and
the news is .... better.
- compiling the suite with the standard options (including optimisation
level O2) - the compiled code still does not work.
- compiling the WHOLE suite (not just progs) with the compiler
optimisation level O0 - the suite does work!!! Well it compiles and
$CEXAM/unix/runnable/run-all works (apart from hbond for some strange
reason).
the way I did this was:
- up2date my Linux redhat 7* system to the new compilers
- download and unpack the ccp4 package
(remember to check the
ccp4 problems pages
for fixes to some programs)
- edit and source ccp4.setup as usual
- run configure --with-your-options linux as usual (shared lib not tested)
- edit $CCP4/config.status - change as below:
FOPTIM="-O" COPTIM="-O"

to

FOPTIM="-O0" COPTIM="-O0"
and re-run the config.status script (this in turn will re-run configure
with the altered options)
- make and install as usual.
I am assuming that the values the programs produce are sensible - I'm just
pleased they didn't crash...
some system info:
ccp4h 2:57pm /runnable>45% rpm -q gcc glibc
gcc-2.96-85
glibc-2.2-12
If anybody has any other/similar/more experiences please let me know. In
turn I will let Kevin know and maybe he can update his
excellent summary
page.
Summary from the enquirer:
I now have the following system:
- redhat 7.0.
- upgraded compiler from Redhat (using up2date) to gcc-2.96.85 (and g77 etc)
- installed gcc(etc) 3.0 in /usr/local/bin - this was straight-forward
following this I had a clean distribution of CCP4 4.1.1. I configured as
.../configure --with-x linux
then edited $CCP4/config.status and changed
FC to /usr/local/bin/f77 and
CC to /usr/local/bin/gcc
ran config.status (NB no change to optimization level)
make and make install of the suite.......
ran the $CEXAM/unix/runnable/run-all script.....
AND IT ALL WORKED! again I hasten to add that the programs ran and didn't
crash (so I'm assuming they gave sensible answeres).....
so in summary this probably isn't the best way to have your linux box set
up but it does at least give a working compiled version of CCP4 for redhat
7* boxes.
I hope this helps. If the demand is really there I will make a web page
(or Kevin might update his) with detailed instructions. Though my real
current recomendation is - stick with RedHat 6.2.
A while later, Kevin adds to this:
Just to set the record straight, I would like to state here and now that the
problems people have been having on RedHat 7.1 and 7.2, and other linux
distros, are not the fault of the compilers shipped with 7.1 or 7.2.
(either 2.96rh, or 3.0).
There are some assumptions in some ccp4 code, which are technically invalid
with the F77 spec, but have been traditionally incorrectly implemented in the
majority of Fortran compilers. g77 is exceptional in interpreting the
specifications correctly.
To compile ccp4 on Linux, simply add
-fno-automatic
to the XFFLAGS in all the makefiles.
The resulting code will give sensible results using the example refmac
scripts. (Of course there may be smaller problems not picked up by this test,
if so we now have a chance of finding them.)
To summarise: Redhat did good. We didn't.
Chemical discussions
Selenomethionine
Selenomethionine oxidation during RP-HPLC
(May 2001)
I'd like to purify a small disulphide-rich protein containing
selenomethionine for MAD on a C8 reverse phase column. The buffers I
normally use contain 0.1% TFA and Acetonitrile and are purged with helium,
but the disulphide bonds in my protein don't allow me to use a reducing
agent such as DTT or beta-mercaptoethanol. If anyone has had to deal with
a similar case before, could they please let me know whether the
selenomethionine became chemically modified during this purification step.
Summary from the enquirer:
- Why not do the structure with oxidised SeMet protein? Oxidised selenium
gives a stronger MAD signal than reduced selenium. The problem is when you
get mixed oxidation states, because then you don't get any absorption peak
at all. That's why most people add DTT to their crystallisation buffers.
You could try crystallising in the presence of an oxidising agent instead.
If your problem is not that huge (i.e. relatively few seleniums [20-ish],
relatively small protein [30 kDa-ish]), then you can probably even get
away with using the remote wavelength, where there is no absorption peak
and a relatively weak anomalous signal. But then you have to collect your
data properly.
- If your protein's folded and disulphided, and you then add DTT, does it
unfold? Because if not, it's often okay to reduce the SeMet only just
before you freeze the crystal, because the SeMet oxidation is reversible.
So, you purify and crystalize the thing without DTT, and in the minutes or
hours before mounting, you add the DTT.
- Have you considered using the sulphur anomalous scattering to solve the
phases? May be possible with sufficient resolution (e.g. using ACORN).
This summary raised a few issues:
- Pardon me but do not get that. The Se has a absorption edge, no matter what.
The stronger 'oxidized' edge is probably an electronic effect at the XANES
creating an additional component seen as a white line feature (the peak above the
edge jump level). A different chemical environment shifts the edges (up
energy when oxidized, few eV) and may lead to a superposition and thus
broadening of the edge. The no signal theory I do not understand?
- I also do not quite understand what exact species the 'oxidized Selenium'
or what oxidized Se-Met actually is. Does anyone have some insight into
that?
- I don't understand the rather cavalier attitude towards Se-Met oxidation.
For one of the proteins I worked on, Apo A-I, oxidation of the (sulfur) methionines
DRAMATICALLY alters the physicochemical and biological properties of the
protein. The reason is obvious....Met is a hydrophobic side chain; oxidized
Met is VERY hydrophilic (it is basically like the universal solvent DMSO) and
has a strong, permanent dipole moment.
I would imagine that the properties of most proteins would be altered if you
suddenly stuck a (delta+)Se--O(delta-) bond in the middle of the hydrophobic
core. I think care to prevent Se-Met oxidation is called for.
Answers to these questions:
- Of course selenium still has an edge, but that reply stated "mixed
oxidation states", "you don't get" and "peak", not
"there is no" and "edge".
In my experience the peak (the anomalous signal) is far more important for
MAD than any dispersive signal (which is very small anyway if the edge is
no good), because it allows you to solve the substructure. In fact, I go
for the peak and remote, and consider the peak a luxury.
Yes, the edge gets broadened, and so similarly the peak gets flattened,
especially because the oxidised peak sits on top of the reduced edge. At
least, its net effect changes that way, but that's what the anomalous
signal is after all.
Have a look at:
- AJ Sharff, E Koronakis, B Luisi and V.Koronakis,
Acta Cryst. (2000). D56, 785-788,
Oxidation of selenomethionine: some MADness in the method!
- Smith, J. L. & Thompson, A. (1998). Reactivity of selenomethionine - dents in the magic bullet?
Structure 6, 815-819,
through PubMed.
- Mono-oxygenated (I believe):
        CH3
        |
        Se=O
        |
        CH2
        |
       ...
- We recently phased a difficult protein with 1 Se per 90 residues using
MAD. Origionally, we were unable to see a signal or find the Se
positions. We subsequently pushed the Se to the oxidative state with
the addition of HOOH. On our second trip to the synchrotron, we got a
great adsorption spectrum and have now found all the seleniums, phased
and are now model building. The oxidation of the selenium appears to be
the key.
Besides, oxidation should result in the removal of electrons from the Se.
- We have collected MAD data on a fully (naturally) oxidised and fully
reduced (using DTT) selenomethionine protein, and found that they are
isomorphous except for the bound water molecules to the oxidised
selenium atoms (Thomazeau et al.,
Acta Cryst.D57,1337-1340).
So my idea about the question is that again, it depends on the protein.
BR's lecture on Se-Met and X-ray absorption
(May 2001)
The following was a posting in reaction to the previous discussion
(about Selenomethionine oxidation during RP-HPLC).
It is reproduced almost exactly as it was posted, with an addendum/erratum from the author
at the end.
I got flamed for Borhani's message - don't worry I can take it -
and received a few comments that make me wonder whether we use the same
language here in terms of X-ray absorption. X-ray absorption is
a lot less mystical than crystallization, so even at the risk of
appearing redundant/boring/condescending you name it I shall briefly
summarize for the more biologically inclined (admitting that I
simplify as I feel it's permissible without being flat out wrong;
if something is absolutely stupid or incomprehensible please
tell me; textbook references at the end).
A bound electron can absorb a photon and leave its original
energy level (orbit). The atomic level (quantum number n) it
originates from is used to name the edge - K (1) L (2) M (3) etc.
The lower (tighter bound) the level and the more protons in the
nucleus (heavier the element), the higher the absorption edge energy.
Then the question is what happens to the electron. Assuming a free atom for
now, absorbing at or above the binding energy the electron can take off into
the vacuum and turn into a photoelectron (more about condensed state
below), or at slightly lower energies, it can
jump into unoccupied higher levels (states)
of the atom (if the electron kicks out another electron from a higher occupied
level, we have a secondary Auger electron but due to their low energy - except
for line broadening - the Auger processes are of no relevance for us here).
The superposition of all the discrete possible lower energy resonance transitions in
the series plus the phototransitions at the series limit create each absorption edge.
The sum (integration) of the closely spaced and life-time broadened transitions
at the series limit gives an arctangent curve (sigmoid shape) for the basic absorption
edge. The sharp, saw-tooth curve in theoretical absorption cross section
calculations results from assuming sharp photoelectric transitions. The most
prevalent code I know and use to calculate absorption coefficients/edge
energies is Don Cromer's FPRIME (note from mgwt: the best link I could find is
a PDF file: GSASmanual.pdf).
In case of high transition probabilities, some of the pre-edge
resonance transitions can be rather high, and give rise to stronger absorption.
These pre-edge features are also called white lines, because some of the old
dudes (like those who wrote all these nice F-66 CCP4 programs for you) used
film to record absorption: Less X-rays on film due to absorption in the sample
means less blackening on the negative (i.e., a white line at that energy).
White line resoncances obey dipole selection rules, and their intensity
depends on transition probabilities and initial and empty state density.
K-edges have weaker white lines (s->np transitions) as do L1
edges (n=2,l=0,j=1/2 2s -> nd, n>2) which have 'K- or S-character' due to
l=0 compared to l=1 for L2 (n=2,l=1, j=1/2) and L3 (j=3/2) edges.
The L3 edge is at the lowest energy of the L series and twice as high as L2,1
due to the transition from the 4 2p3/2 states, at L2 (few keV higher energy)
there is usually also less intensity from the ring (above critcal energy).
It appears that the white line features are what some call 'peak', so
when they talk about 'disappearing peak' they may mean a smaller white line,
not the whole edge disappearing. Btw, that white line region at the low
energy of the edge is called the XANES (Xray Absorption Near Edge
Structure).
Now to finally sort XAS out, we need to
consider condensed matter. A bit
more delicate, but it will become clearer (harharhar). First, on its
way out of the atom, an above-edge energy photoelectron can bounce off
the neighbouring atoms. If there is a distinct near range order - like in a
let's say octahedral environment - the resonance absorption cross section
oscillates in a decaying way with a period distinct (reciprocal, as you
guessed) to the distances in the coordination shell geometry in the environment.
The amplitude envelope of these periodically extending EXAFS wiggles tells you about
the nature of neighbouring atoms - the heavier the more 'wavy' the envelope becomes.
So, if you have a rapidly decaying EXAFS (Extended Xray Absorption Fine
Structure) you know that you have light atoms and/or inhomogenous environment
around your anomalous atoms - which does not mean much:
Unfortunately, detailed EXAFS analysis requires much better scans
than we usually do and the difference between a Se atom in solvent and
in the protein environment is not all that big. Well-defined metals
in active sites (plastocyanine, cytochrome c oxidase, laccase etc) can
have in fact an interpretable EXAFS. It naturally also kinda works in
solid matter, but deconvolution is occasionally overdone (30 data points
25 parameters - sounds familar to the low res victims, doesn't it?).
On top of this, if in a chemical environment outer electrons get stripped
(oxidation, delocalization etc) the remaining electrons feel more of
the nuclear charge thus more energy required thus upshift of the edge
features (someone got confused about that apparently). Shifts
range in few to a few 10 eVs, and you nearly always need a reference
spectrum to determine absolute values (think monocromator slew
for example - which is one reason why it is not a bad idea to move
the crystal (energy) from the same side to the peak as you did in your
scan).
The condensed state environment also allows due to symmetry violations
(think Jahn-Teller) additional transitions in the pre-edge region that where
verboten before, plus allows additional band levels to become occupied by
photoelectrons. This means that larger white line features often appear. The same holds
for any new bound or localized states, like in oxides, which become now
available compared to the free atom case we described in the beginning.
All of the above to varying degree is the reason why a) the oxidized Se-Met
spectrum is upshifted, b) the white line in the solid Selenate sample shown
in the Structure6:815 paper is so huge, and less high for oxidized Se-Met in
protein.
Now let us consider what happens in an inhomogenous environment:
First, each Se that is present will absorb. There is no absorption quenching
or any funky similar stuff. If it's there, it will contribute to signal.
Chemically different species will add, and we will obtain a sum of the
partial spectra. This means that
the white line features can become less sharp, as will the whole
edge. But: After the edge, the total signal will be the same - i.e., if your
Se's remain in periodic positions - oxidized or not - up-edge (remote) anomalous data
can give a decent signal/map (but less white line - or 'peak' contributions to f" of
perhaps a few tenth to a few e- ). For the f' (inflection wavelength), we have a
worse scenario: the slope of the edge and/or peak becomes flatter - thus
the derivative (equivalent to the Kramers-Kronig transform) is much smaller and
your dispersive gain from sitting on f'max (inflection point) suffers drastically.
If the anomalous scatteres are all over the place then signal but of course no map.
Backsoaking of heavy metals derivatives for anomalous data collection is
thus advisible.
Based on above, I cannot rationally explain how one can have no signal (I mean
no edge, not only no 'peak', or white line), then oxidize the same material,
and get an absorption scan. Sounds like some trans-substantiation. Most
likely I did not understand the story right.
For more details on the L-edge and white line superposition stuff you
can glance over the mini-intro (II, III) in that Physical Refuse article:
moment_collapse.pdf.
Details: Agarwal, X-ray spectroscopy, Springer, chapter 7
Another interesting point: If one measures above the edge past the white lines,
very good monochromaticity (low bandwidth) actually is not necessary and rather
a waste of beam. A beam with a bandwidth not exceeding the mosaic spread of
the crystal would allow a really fast (or good signal/noise) data collection
about 100 eV above the edge. The anomalous signal is nothing to sneer about
there and the gain for SAS in data quality could be tremendous. Any thoughts
on that from the SAS gang? I mean going from 1 to 10 eV bandwith does contribute
to spot size (below) but ~10 times the bang should do something for the
data!
Problem to be solved:
The beam fans out to about ~30 mrad at 0.1% bandwidth at 1.0Å after the
monochromator and needs to be refocussed:
0.1% 12.35eV bandwidth at 12.35 keV (1.000Å)
0.9005 to 1.0005Å
on Si 111 (d 001 = 5.43), d(111)= 3.14 (Pi, funny, isn't it?)
lambda/2d=sintheta
I get delta theta of .923 deg = 1.8 deg 2theta = 30 mrad
which is ugly.
Less excessively, let's say at 0.8 deg or so this might actually
be useful. Lots of partials though.
Any thoughts on feasibility?
Knowledge of the absolute of the fs is actually unimportant here btw.
Addendum/erratum:
Of course I stuck my foot into my mouth on this one - the calculation
of the spread is wrong 1.0 - 0.0005 is NOT .9005 dah...I had already a
bad feeling - thx to Pierre for actually reading my blurb and
finding that mistake. Consider that even the Cu natural line width
at 8keV is 2.6 eV which has no practical effect on point spread.....
Bart pointed out that 3rd generation sources fry the crystal dead
anyhow so why bother - that is true, I was admittedly more thinking
along maximizing weaker sources like small Compton sources (a electron
bunch is 'wiggled' by a laser) which, using the broader bandwidth,
may begin to compare well to synchrotron sources.
Correction of the same calculation of 0.1% bandwidth spread
at 1Å (1.0005 to 0.9995 <-!) leads to 0.02 deg (0.4 mrad) in
2theta which is negligible as it should be. So even wider
bandwidth ranges would be possible for flux gain in the
scenario I described. Problem solved.
Selenomet from O and REFMAC5
(June 2001)
I am using Refmac5 through the CCP4I-4.1.1 interface and am wondering
whether selenomethionine (MSE) is being recognized properly on
coordinate file input.
To start, I mutated MET to MSE in 'O' and here is representative output
of the relevant part of the coordinate file from 'O':
ATOM    320  N   MSE X  41      29.824  31.488  35.626  1.00 11.19   7
ATOM    321  CA  MSE X  41      29.652  32.610  36.538  1.00 11.64   6
ATOM    322  CB  MSE X  41      28.225  33.094  36.510  1.00 12.01   6
ATOM    323  CG  MSE X  41      27.852  33.686  35.170  1.00 14.13   6
ATOM    324  SE  MSE X  41      28.681  35.384  34.700  1.00 20.00  34
ATOM    325  CE  MSE X  41      27.259  36.407  35.447  1.00 17.00   6
ATOM    326  C   MSE X  41      30.038  32.246  37.955  1.00 11.06   6
ATOM    327  O   MSE X  41      30.707  33.006  38.648  1.00 10.75   8
Note "34" for SE in the last column of the fifth row.
Using the above coordinate file from 'O' as input, here is the resulting
relevant part of the output file after refinement with Refmac5:
ATOM    629  N   MSE X  41      29.826  31.486  35.628  1.00
11.15           N
ATOM    631  CA  MSE X  41      29.653  32.611  36.538  1.00
11.57           C
ATOM    633  CB  MSE X  41      28.227  33.091  36.512  1.00
11.90           C
ATOM    636  CG  MSE X  41      27.851  33.685  35.175  1.00
14.00           C
ATOM    639  SE  MSE X  41      28.681  35.387  34.704  1.00
5.03           S
ATOM    640  CE  MSE X  41      27.244  36.414  35.435  1.00
16.74           C
ATOM    644  C   MSE X  41      30.036  32.247  37.952  1.00
10.98           C
ATOM    645  O   MSE X  41      30.706  33.002  38.641  1.00
10.84           O
From the above, Refmac5 appears to be interpreting the SE atom (34
electrons) as sulfur (16 electrons) (I guess also giving the
unexpectedly low B value for Se).
Summary from the enquirer:
Refmac must read "SE" starting at either position 13 or position 77 in an ATOM
(or HETATM) record.
On the other hand, 'O' outputs coordinate files with SE aligned with the
standard amino acid atom identifiers (starting in position 14) and atomic number
for the element in position 69 or 70 (for one digit or two-digit atomic numbers,
respectively).
So, the first ATOM record below will not be read properly by Refmac5; editing
this line to either of the formats in the second and third lines will work:
ATOM    198  SE  MSE X  26      16.208  48.882  45.142  1.00 13.97  16
ATOM    198 SE   MSE X  26      16.208  48.882  45.142  1.00 13.97  16
ATOM    198  SE  MSE X  26      16.208  48.882  45.142  1.00 13.97          SE
Glycerol - bad or good?
(May 2001)
I have a not crystallographic computing related but still interesting
question. As often in protein crystallization, firm and validated information
is rare and thus in this case I am happy to solicit also opinion and
anecdotal evidence.
Glycerol is used to protect proteins while being stored frozen. This
is a particular issue for any high-throughput operations, where the
protein cannot be processed immediately and needs to be stored in
aliquots until machine time becomes available.
Now, the question is, how high a price will you have to pay later in
crystallization success rate if you do not dialyze the glycerol out? I.e, what
is the overall statistical chance that it is harmful vs. not?
In particular, has reduced diffraction quality (vs.non-gycerol) been observed?
I clearly understand that some proteins do crystallize fine with
glycerol as additive, and we have it also in CRYSTOOL, but as a
principal component in the protein stock,
at lets say 10%, what's the effect? Does anybody have hard numbers
(or some statistics) on that or at least more than single case evidence for
the one or the other?
Electronic web research in Medline and inspec did not provide a lead.
Manual search in J. Crystal Growth (1889-90) where we hoped to find an
article presented at the first ICCBM conference in 88 was negative.
Please let us know if you can help with any information, references or
leads.
Summary from the enquirer:
Probably more bad than good. If you don't need it, don't have it in. If you need it for stability, don't worry
(actually, you are free to worry). There are no crystallization data on possible substitutes for glycerol either.
Glycerol may be useful as a retardant when things grow too fast (problem also often seen in nanodrops?)
Snap freezing sounds interesting. Anyone else use that?
It would be a good idea to use the robots for a systematic study. Ok, I will.
For full discussion, see
Current Opinion in Crystallization.
Monovalent cations
(April 2001)
I am seeking guidance on interpreting
e-density that appears to arise from monovalent cations -- how to
differentiate, e.g., Na+, K+, NH4+. Any relevant references and/or
programs would be appreciated.
Summary from the enquirer:
It goes without saying that resolution of data is
critical in differentiating possibilites (my data are to 1.5Å).
- Different number of electrons for different metals will obviously
give different local electron densities (possibly can also make use of
differences in anomalous signals for metal sites).
- Look at USF program
XPAND -- "water
scrutinizer" option -- which checks for possibilities other than HOH.
I think using the approach of M Nayal & E Di Cera,
JMB 256,
228-234 (1996) -- this paper describes the calculation of valence for
metal-to-ligand interactions [the valence calculation quantitates
distances for all metal-to-ligand interactions for a putative metal
site, and relates these to expected distances and coordination numbers
for potential ions; e.g., (K+) should have longer metal-to-ligand bonds,
on average, than (Na+)-to-ligand]. The Di Cera valence analysis has
been developed by the author into the WASP program (WAter Screening
Program) -- see
WASP program source or
contact enrico@caesar.wustl.edu
- Valence bond calculation methods are being implemented by George
Sheldrick (I'm not sure if part of ShelX) -- suggested to contact Dr.
Sheldrick directly to inquire.
- Some general references were also suggested:
- SJ Cooper .. WN Hunter (1996)
Structure
4: 1303-1315 The crystal
structure of a class II fructose-1,6-bisphosphate aldolase shows a novel
binuclear metal-binding site embedded in a familiar fold [includes table
comparing Metal-N, Metal-O distances [Metal = K(+), Zn(++)] from CCDC]
- CA Bonagura .. TL Poulos (1999)
Biochemistry
38: 5538-5545 The effects
of an engineered cation site on the structure, activity, and
EPR properties of cytochrome c peroxidase
- S Rhee .. DR Davies (1996)
Biochemistry
35: 4211-4221 Exchange of K+ or
Cs+ for Na+ induces long-range changes in the thre-dimensional structure
of the tryptophan synthase a2b2 complex [tabulates Na(+)-O, K(+)-O and
Cs(+)-O distances in tryp synthase]
- Bond-valence calculations can be done using a different equation than
that used in the above-mentioned Di Cera paper:
- Brese, N. E. & O'Keeffe, M. 1991. Acta Cryst. B47: 192-197. Bond-Valence Parameters for
Solids.
- Carugo, O., Djinovic, K. & Rizzi, M. 1993. Comparison of
the Co-ordinative Behaviour of Calcium (II) and Magnesium (II) from
Crystallographic Data. J. Chem. Soc. Dalton Trans. 2127-2135.
An example using this alternate equation was kindly provided:
vij=exp[-(dij-Rij)/b]

vij-bond valence for bond between i and j
dij-bond length between i and j
Rij-bond-valence parameter
[K+ 2.13 for O, 1.99 for F, 2.52 for Cl
Na+ 1.80 for O, 1.677 for F, 2.15 for Cl]
b-"universal" constant b=0.37

V=vij(1)+vij(2)+...

V-valence of the metal centre


dij (O-Me)      vij (Na+)
2.78            0.07
2.47            0.16
2.30            0.26
2.58            0.12
2.30            0.26
2.25            0.30

V=1.17 (in my case I was sure that it cannot
be Ca2+ - I checked anomalous signal)
Atoms used for anomalous dispersion (a survey)
(April 2001)
We have recently solved the structure of the PDZ1 domain of Na+/H+ exchanger regulatory factor
using the dispersive signal from the LIII edge of Mercury (see Webster at al. (2001)
Acta Cryst D57,
714-716 and our
J.Mol.Biol.308, 963-973 (2001) paper). We were unable to obtain satisfactory
expression of our protein from selenomethionine auxotrophs and only obtained a single mercury
derivative in spite of an extensive heavy atom screen from which the SIR phases were insufficient
to solve the structure.
In the end then, we decided to try a MAD experiment using our lone Mercury derivative and obtained a
beautiful anomalous signal at three different wavelengths on beamline F2 at CHESS. An analysis of our
data with SOLVE yielded excellent phases and a model consisting of over 80% of the protein was built
by ARP/WARP in the first electron density map calculated with the new phases.
I was wondering whether anybody had done a survey of elements other than Selenium that have been
successfully used for structure determination with MAD, since it seems that a lot of time can be saved
if even a single, suitable heavy-atom derivative of a protein can be obtained for such an experiment. I
know that there are plenty of tables of wavelengths and dispersive differences for different elements, but
I would be very interested to see if anybody had compiled statistics for which elements had actually
worked for MAD structure determinations. Such a survey might beneficially bias our choice of which
heavy-atoms are worth screening first, especially if the biological labelling of proteins is not an option
due to time constraints or technical problems at the level of expression etc.
Summary from the enquirer:
It seems that there hasn't really been a comprehensive review of this for some time now. I was
pointed to an article in Synchrotron Radiation News Vol 8 No 3, pp 13-18 (1995) written by Craig
Ogata and Wayne Hendrickson, and a later article from 1999 also by Wayne
Hendrickson (J. Synchrotron Rad. 6, 845-851).
People at Daresbury have found Xenon at high pressure to be an excellent
choice, their results for this work on the structure of crustacyanin is Cianci et al.
Acta D.57,1219-1229.
Note that sulphur (sulfur if you celebrate July 4th) has a useful
anomalous signal at around 2.0Å and work using this method will be published in a
forthcoming paper.
It is commented that 3 wavelength experiments are often unnecessary and that
the anomalous signal from a single atom of e.g. iron or zinc per protein molecule can be enough for
structure determination with MAD. Also advocated is the use of elements that have a significant
anomalous signal close to the copper K-alpha wavelength and therefore do not require a trip to the
synchrotron. Even mercury has 7.7 anomalous electrons at 1.54Å and it was suggested that
we might possibly have been able to solve our PDZ structure in-house.
A protein using Xenon at 1.54Å, with 4 atoms per 47 kDa molecule (another plug for Xe there), has
just been solved.
A whole slew of elements (Fe, Co, Zn, Se, Br, Rb, Ta, W, Re, Os, Ir, Pt, Au, Hg,
Tl, Pb, U) was listed, with which success has been had on the beamline I9ID at the APS (Argonne Il.). It
was pointed out that Se-Met has become a very popular choice due to the very high success rate that it has for
phasing. The number of Se atoms generally increases with the size of the protein and there
is no disturbance of the crystals by soaking as is required for traditional heavy-atom labeling.
My own experience with Se-Met has led me to ...
WEBSTER'S LAWS OF METHIONINE DISTRIBUTION
"The probability of a methionine residue occurring in a protein is inversely
proportional to my desire to solve the structure of that protein"
"The probability of finding a methionine residue at any given point in my protein is
directly proportional to the conformational flexibility of my protein at that point"
Please don't flame me or bombard me with your "selenomethionine has changed my life"
stories, I know it works very well, but I just haven't been very lucky with it so far!
A third article was mentioned:
C. Ogata (1998) "MAD phasing grows up" Nat Struct Biol Synchrotron suppl, 638-640.
Somebody mentioned they did a survey of the elements used for MAD a few years ago
(but did you publish the survey?) and also cited many of the elements in the list above.
Another made the excellent suggestion of having specific phasing records included in the PDB database
format. This would make the compilation of the kind of statistics that I was after, effectively automatic, since
users would be able to compile their own surveys directly from the database itself. How about it RCSB?
It was pointed out that you can do MAD with any element that has an absorption edge within the
energy range of the most commonly used beamlines (7000 - 15000 eV) and that L-edges like the one that
we used in our PDZ structure determination, often give better results than K-edges. Along with mercury,
gold and lead are recommended as good candidates. Reservations are expressed about using platinum
which tends to yield many poorly occupied sites and a resulting poor signal. Also recommended:
Lanthanides for their excellent signal with the caveat that they may be harder to get to bind to your protein
(apparently they substitute for Ca very well in Ca binding proteins). Tantalum bromide has been used for very
large cells (didn't they use this for the ribosome?). And again the recommendation for trying
high pressure derivatization using Xe and NaBr.
Beryllium Fluoride-ADP
(September 2001)
I'm looking to purchase Beryllium fluoride to use in combination with ADP as
a transition state analogue of ATP. Sofar my searches in catalogues (on-line
and on plain paper, Sigma, Aldrich, Fluka) yielded nothing. Does anyone have
experience in these matters? Do we have to make it ourselves?
Summary from the enquirer:
- Do you really want to work with this? It is VERY Toxic!
Enquirer: Well, I must say I'll think it over again after all the warnings.
Maybe Aluminium Fluoride is a good alternative.
- BeF2 can be purchased. Three companies have been mentioned to me,
Alfa-Aesar (Germany), Interchim (France) and Strem (US).
- BeF2 more often is made by adding proper quantities of BeCl2 and KF (or
NaF). The extra KCl (or NaCl) in the drop should not worry us!
Enquirer: OK, fair enough. At least I won't have at least 5 grams of BeF2 left
in our chemical storage after this experiment!
Mercury Phenyl Glyoxal
(October 2001)
We are currently investigating the possibilities of covalently
bonding heavy-atoms to specific residues types using modified reagents,
for use in structure determination through MIR, etc...
We have a review citing the use of mercury phenyl glyoxal as an
arginine specific reagent, and have found the recipe for it on the web,
but our collaborators reckon that the reaction conditions for it are
nowhere near strong enough to force mercury onto a phenyl ring...
They have used this recipe, and using NMR, have discovered that
all you get back at the end is the phenyl glyoxal that you started with...
Other than Don Wiley's work (which did use Phenyl glyoxal,
but it did not bind to the Arg residues), has anybody...
- got a decent prep for Hg-phenyl glyoxal that they KNOW works
- actually solved a structure using Hg-phenyl glyoxal AND seen it
bound to arginines
Summary from the enquirer:
It seems to be the general consensus that the prep for mercury
phenyl glyoxal on the Metazoa.com
website is wrong. Other alternatives
have been suggested and we'll let you know if they work when it happens...
The mercury phenyl glyoxal as reported in Wilson et al Nature,
289, pp386, 1981, was in fact not Mercury phenyl glyoxal, and the heavy
atom sites bound were due to residual mercury in the compound.
The two structures that claim the use of Mercury phenyl glyoxal
are Haemagglutinin (2HMG)(from Don Wiley, reference above) and Galactose
binding protein 2(GBP). None of the mercury sites are anywhere near an
Arg.
It does seem like mercury phenyl glyoxal is a bit of a myth.
Various
XYZ-limits and real space asymmetric units
(November 2000 and January 2001)
I use :
.....etc
#-------------------- crystallographic project data -----------------------
# the unit cell dimensions
set cell = ( 140.080  140.080  271.630  90.00  90.00  90.00 )
# spcgrp
set spacegroup = ( p43212 )
# spcgrp no. in symm
set symm = ( 96 )
# FFTSYMMETRY
set sfsg = ( p43212 )
# fftgrid GRID
# set grid = ( SAMPLE 3 ) does not work for SFALL
set grid = ( 128 128 512 ) <--- note : nx=2n, ny=nx, nz=8n (n=64) as per FFT
instructions
# the asymm unit box for SFALL/FFT
# set xyzlim = (ASU) does not work for EXTEND
# set xyzlim = ( 0 1 0 1 0 0.25 ) for p212121
# set xyzlim = ( 0 1  0 1  0 0.33333 ) for p31
# set xyzlim = ( 0 1  0 1  0 0.166667 ) for p61
set xyzlim =   ( 0 1  0 1  0 0.125 ) <--- per instructions and tables
# -----------------------------------------------------------
....etc
REFMAC, EXTEND, and FFT run fine. ARP finally gets mad at me as follows:
Map limits Z 0 64 <== This is incorrect Recommended 0 256
What is different in ARP compared to the other programs that take my grid
input?
Do I need xyzlimits in (0 128 0 128 0 64) format and not fractional?
Do I need the FULL cell in the xyzlimits? But this is not P1 as in general
cases?
Quick-and-dirty answer:
Not that I really know how it works, but here's an absolutely filthy fix
that seems to work, at least for the spacegroups which I tried. If you
specify GRID SAMPLE in FFT, then there's a line in the log file that says
"Map limits in grid points on xyz"
and some numbers. Add 1 (one) to those numbers and give them to EXTEND as
grid, then ARP is happy.
Slightly more sophisticated answer:
For P43212 (96) you'll need the following asymmetric units
  FFT    0. 1.  0. 1.  0. 0.125
  SFALL  0. 1.  0. 1.  0. 0.125
  ARP    0. 0.5 0. 0.5 0. 0.5
There are consistent inconsistencies with real space asymmetric units
between the various programs.
Another solution:
The easiest is simply to define the AU limits
in fractional coords in MAPMASK ... just take care in trigonal and cubic sg's
to use 0.334 instead of 0.333333 and 0.0834 instead of 0.08333333.
I actually think that only ARP is 'inconsistent', but it's very
polite on telling you what it really needs as AU limits.
Another response:
ARP is not alone: I can think of other 'inconsistencies' too. Compare
the asymmetric units FFT is using with the ones SFALL requires:
  Spacegroup      FFT                           SFALL
               X      Y       Z           X      Y       Z
    P21212   0. 1.  0. 0.25 0. 1.       0. 1.   0. 1.   0. 1.
    C2221    0. 0.5 0. 0.25 0. 1.       0. 1.   0. 1.   0. 1.
    C222     0. 0.5 0. 0.25 0. 1.       0. 1.   0. 1.   0. 1.
    F222     0. 0.5 0. 0.25 0. 1.       0. 1.   0. 1.   0. 0.25
    I222     0. 0.5 0. 0.25 0. 1.       0. 1.   0. 1.   0. 1.
    P4212    0. 1.  0. 0.25 0. 1.       0. 1.   0. 1.   0. 1.
    P4122    0. 1.  0. 1.   0. 1.       0. 1.   0. 1.   0. 0.125
    P4322    0. 1.  0. 1.   0. 1.       0. 1.   0. 1.   0. 0.125
    I422     0. 0.5 0. 0.25 0. 1.       0. 1.   0. 1.   0. 1.
    P3       0. 1.  0. 1.   0. 1.       0. 0.67 0. 0.67 0. 1.
    P622     0. 1.  0. 1.   0. 1.       0. 0.67 0. 0.67 0. 1.
    P6322    0. 1.  0. 1.   0. 1.       0. 0.67 0. 0.67 0. 1.
    F23      0. 0.5 0. 0.25 0. 1.       0. 1.   0. 1.   0. 0.25
    I23      0. 0.5 0. 0.25 0. 1.       0. 1.   0. 1.   0. 1.
    F432     0. 0.5 0. 0.25 0. 1.       0. 1.   0. 1.   0. 0.25
    F4132    0. 0.5 0. 0.25 0. 1.       0. 1.   0. 1.   0. 0.25
    I432     0. 0.5 0. 0.25 0. 1.       0. 1.   0. 1.   0. 1.
(I'm not totally sure about these different requirements: some of them
are probably due to the differences in spacegroup-specific routines
FFT and SFALL use. But it gives you an idea.)
So sometimes you need to put a MAPMASK/EXTEND step between. Anyway,
once you know the various asymmetric unit definitions you can easily
extend your maps.
Then an extensive list for ARP, just to be complete:
If you use these limits in MAPMASK before ARP/wARP it should work.
1 : 0 1 0 1 0 1
2 : 0 1 0 1 0 0.5
3 : 0 1 0 1 0 0.5
4 : 0 1 0 0.5 0 1
5 : 0 0.5 0 1 0 0.5
16 : 0 0.5 0 1 0 0.5
17 : 0 0.5 0 1 0 0.5
18 : 0 1 0 0.25 0 1
19 : 0 1 0 1 0 0.25
20 : 0 0.5 0 0.5 0 0.5
21 : 0 0.25 0 0.5 0 1
22 : 0 1 0 0.25 0 0.25
23 : 0 0.5 0 0.5 0 0.5
24 : 0 0.5 0 0.5 0 0.5
75 : 0 0.5 0 0.5 0 1
76 : 0 0.5 0 0.5 0 1
77 : 0 0.5 0 0.5 0 1
78 : 0 0.5 0 0.5 0 1
79 : 0 0.5 0 0.5 0 0.5
80 : 0 1 0 0.5 0 0.25
89 : 0 0.5 0 0.5 0 0.5
90 : 0 0.5 0 0.5 0 0.5
91 : 0 1 0 1 0 0.125
92 : 0 0.5 0 0.5 0 0.5
93 : 0 1 0 0.5 0 0.25
94 : 0 0.5 0 0.5 0 0.5
95 : 0 1 0 1 0 0.125
96 : 0 0.5 0 0.5 0 0.5
97 : 0 0.5 0 0.5 0 0.25
98 : 0 1 0 0.25 0 0.25
143 : 0 1 0 1 0 1
144 : 0 1 0 1 0 0.334
145 : 0 1 0 1 0 0.334
146 : 0 0.334 0 0.334 0 1
149 : 0 1 0 1 0 0.5
150 : 0 1 0 1 0 0.5
151 : 0 1 0 1 0 0.167
152 : 0 1 0 1 0 0.167
153 : 0 1 0 1 0 0.167
154 : 0 1 0 1 0 0.167
155 : 0 0.334 0 0.334 0 0.5
168 : 0 1 0 0.5 0 1
169 : 0 1 0 1 0 0.167
170 : 0 1 0 1 0 0.167
171 : 0 1 0 0.5 0 0.334
172 : 0 1 0 0.5 0 0.334
173 : 0 1 0 1 0 0.5
177 : 0 1 0 0.5 0 0.5
178 : 0 1 0 1 0 0.0834
179 : 0 1 0 1 0 0.0834
180 : 0 1 0 0.5 0 0.167
181 : 0 1 0 0.5 0 0.167
182 : 0 1 0 1 0 0.25
195 : 0 1 0 1 0 0.5
196 : 0 1 0 0.5 0 0.5
197 : 0 0.5 0 0.5 0 1
198 : 0 0.5 0 0.5 0 1
199 : 0 0.5 0 0.5 0 1
207 : 0 0.5 0 0.5 0 1
208 : 0 1 0 0.5 0 0.5
209 : 0 0.5 0 0.5 0 0.5
210 : 0 0.5 0 0.75 0 0.667
211 : 0 0.25 0 0.75 0 0.667
212 : 0 1 0 1 0 1
213 : 0 1 0 1 0 1
214 : 0 0.667 0 0.75 0 1
CCP4i comes to the rescue:
Conventions - who needs them! As you have noticed the ARP asymm units
and the CCP4 ones are not always the same. Both are in fact correct, but different.
The GUI script adds an extra stage to move the P43212 CCP4 map to the
ARP map. Or you could use FFTBIG XYZ Y X Z to get the whole P1 map then
trim it back to ARP requirements.
Bring on libraries:
The ASU should be determined for most purposes by a library call to
symlib.f:SETLIM. (MAPMASK and many, but not all, other programs do
this). FFT should not be used without a compelling reason. FFTBIG should
be consistent with MAPMASK, otherwise it needs fixing. SFALL is more
difficult.
There are two main reasons for inconsistencies:
- The libraries were written when maps had to be ordered in such a way
as to make an out-of-core fft practical. There are other problems - the
ASU contains duplicate grid points on special sections for most
spacegroups, and whole duplicate volumes in some.
- Some programs don't use the libraries at all.
The solution to (1) is maps which understand their own symmetry and
better ASU definitions.
The solution to (2) is to shoot any programmer who doesn't use them.
These things are in hand for future software, through the provision of
new libraries and superior firepower. On the whole existing software
will, I'm afraid, have to remain hidden under a GUI.
Added to this:
For information, the documentation for the CCP4 symmetry s/r library
SYMLIB ($CHTML/symlib.html on your local system) has an appendix with
the asu limits for both real and reciprocal space (go and have a look!)
It might be useful if the list of Arp asu's was carried in the Arp
documentation?
The real space limits in the SYMLIB document are those which will be
used by any program which calls the CCP4 library routine SETLIM
(reciprocal space limits are from PGNLAU) - unfortunately not all CCP4
programs use this routine, which is where the inconsistencies start to
arise within the suite.
I'm all for Kevin's methods for dealing with programmers who don't use
libraries (btw I hope his reference to "superior firepower" actually
meant bigger and better computers...). In the meantime it would be
useful for us if people could highlight the specific inconsistencies so
that we could start to address the problem at source.
Another question a few months later:
With reference to the list(s) as described/tabulated above:
It appears that at least for #20 SFALL does well using the FFT
grid and does not need P1 expansion - am I interpreting this list wrong?
Is there yet a final, authoritative compilation of settings somewhere?
#  Spacegroup      FFT                           SFALL ARP
#               X      Y       Z           X       Y       Z          X      Y      Z
#    C2221    0. 0.5 0. 0.25 0. 1.       0. 1.   0. 1.   0. 1.      0. 0.5 0. 0.5 0. 0.5
Here is the extract for SFALL limits from the documentation.
X1 and X2 are always set to 0 to NX1-1; 0 to NX2-1;
BUT by far the best way to run sfall is to precede it with MAPMASK to
generate a "whole cell" map and use the inverse FFT in P1.
The other cells are archaic remnants of the days when we were seriously
short of memory and it mad sense to work with the smallest possible map
volume.
MAPMASK mapin asymm_unit.map mapout whole-cell.map
XYZLIM 0 0.999 0.999 0 0.999
AXIS Z X Y
END
then
sfall hklin asymm_unit.mtz hklout asymm_unit+FC.mtz mapin whole-cell.map
SFSG P1
MODE SFCALC MAPIN HKLIN
LABI FP=... SIGFP=...
LABO FC=FC_map PHIC=PHIC_map
END
sfall checks symmetry from the mtz file and outputs a list
of h k l FP SIGFP ... FC PHIC for the asymm unit only.
If you have no HKLIN you must also give SYMM and RESO
but otherwise resist the temptation to add any key words - the programs
are meant to be able to sort themselves out.
Here is the extract from the sfall document:
Limits for axes for the various space groups (these are the same as
those used as defaults in FFT):
- In space group P1, P21 and P21212a, 'b' is taken as the unique axis.
- In space group P21212a, 1/4 is subtracted from the X and Y values
of the equivalent positions given in International Tables.
                   X1     X2     X3     Range of X3  Axis order

       P1          Z      X      Y      0 to Y         Z X Y
       P21         Z      X      Y      0 to Y/2-1     Z X Y
       P21212a     Z      X      Y      0 to Y/4       Z X Y
       P212121     X      Y      Z      0 to Z/4       Y X Z
       P4122       X      Y      Z      0 to Z/8       Y X Z
       P41212      X      Y      Z      0 to Z/8       Y X Z
       P4322       X      Y      Z      0 to Z/8       Y X Z
       P43212      X      Y      Z      0 to Z/8       Y X Z
       P31         X      Y      Z      0 to Z/3-1     Y X Z
       P32         X      Y      Z      0 to Z/3-1     Y X Z
       P3          X      Y      Z      0 to Z-1     Y X Z
       R3          X      Y      Z      0 to Z/3-1     Y X Z
       P3121       X      Y      Z      0 to Z/6       Y X Z
       P3221       X      Y      Z      0 to Z/6       Y X Z
       P61         X      Y      Z      0 to Z/6-1     Y X Z
       P65         X      Y      Z      0 to Z/6-1     Y X Z
Limits for arp are embodied in this code: I guess someone should
tabulate it nicely.
      PARAMETER (ROUND=0.00001, ROUND2=2.0*ROUND)
      PARAMETER (ONE=1.0+ROUND,HALF=0.5+ROUND,THRD=1./3.+ROUND,
     $     TWTD=2./3.+ROUND,SIXT=1./6.+ROUND,THRQ=0.75+ROUND,
     $     QUAR=0.25+ROUND,EIGH=0.125+ROUND,TWLT=1./12.+ROUND)
      PARAMETER (ONEL=ONE-ROUND2,HALFL=HALF-ROUND2,THRDL=THRD-ROUND2,
     $     SIXTL=SIXT-ROUND2,QUARL=QUAR-ROUND2)

C  asulim contains maximum limit on x,y,z: the box is always assumed to
C     start at 0,0,0
C
C  Space group numbers
      DATA NSPGRP/
     $   1,   2,   3,    4,   5,  10,  16,   17,  18,1018,  19,   20,
     $  21,  22,  23,   24,  47,  65,  69,   71,  75,  76,  77,   78,
     $  79,  80,  83,   87,  89,  90,  91,   92,  93,  94,  95,   96,
     $  97,  98, 123,  139, 143, 144, 145,  146, 147, 148, 149,  150,
     $ 151, 152, 153,  154, 155, 162, 164,  166, 168, 169, 170,  171,
     $ 172, 173, 175,  177, 178, 179, 180,  181, 182, 191, 195,  196,
     $ 197, 198, 199,  200, 202, 204, 207,  208, 209, 210, 211,  212,
     $ 213, 214, 221,  225, 229/
C
      DATA ((ASULIM(II,JJ),II=1,3),JJ=1,73)/
C        1:  P1          2:  P-1         3:  P2            4:  P21
     $  ONE,ONE,ONE,   ONE,ONE,HALF,   ONE,ONE,HALF,   ONE,HALF,ONE,
CCP4 $ ONEL,ONEL,ONEL, ONEL,HALF,ONEL, HALF,ONEL,ONEL, ONEL,HALFL,ONEL,
C        5:  C2         10:  P2/m       16:  P222         17:  P2221
     $ HALF,ONE,HALF,   half,half,onel,HALF,ONE,HALF,  HALF,ONE,HALF,
CCP4 $ HALF,HALFL,ONEL, HALF,HALF,ONEL,HALF,HALF,ONEL, HALF,HALF,ONEL,
C       18: P21212    1018: P21212      19: P212121       20:C2221
     $  ONE,QUAR,ONE,  onel,quar,onel, ONE,ONE,QUAR,  HALF,HALF,HALF,
CCP4 $ ONEL,QUAR,ONEL, ONEL,QUAR,ONEL, ONEL,ONEL,QUAR, HALF,QUAR,ONEL,
C       21:  C222       22:  F222       23:  I222         24: I212121
     $ QUAR,HALF,ONE,  ONE,QUAR,QUAR,  HALF,HALF,HALF, HALF,HALF,HALF,
CCP4 $ HALF,QUAR,ONEL, QUAR,QUAR,ONEL, HALF,QUAR,ONE, HALF,QUAR,ONEL,
C       47:  Pmmm       65:  Cmmm       69:  Fmmm         71:  Immm
     $ half,half,half, half,quar,half, quar,quar,half, half,quar,half,
CCP4 $ HALF,HALF,HALF, HALF,QUAR,HALF, QUAR,QUAR,HALF, HALF,QUAR,HALF,
C       75:  P4         76:  P41        77:  P42          78:  P43
     $ HALF,HALF,ONE, HALF,HALF,ONE, HALF,HALF,ONE, HALF,HALF,ONE,
CCP4 $ HALF,HALF,ONEL,ONEL,ONEL,QUARL, HALF,ONEL,HALFL,ONEL,ONEL,QUARL,
C       79:  I4         80:  I41        83:  P4/m         87:  I4/m
     $ HALF,HALF,HALF, ONE,HALF,QUAR,  half,half,half, half,half,quar,
CCP4 $ HALF,HALF,HALF,HALF,ONEL,QUARL, HALF,HALF,HALF, HALF,HALF,QUAR,
C       89: P422        90: P4212       91: P4122         92: P41212
     $ HALF,HALF,HALF, HALF,HALF,HALF, ONE,ONE,EIGH,   HALF,HALF,HALF,
CCP4 $ HALF,HALF,HALF, HALF,HALF,HALF, ONEL,ONEL,EIGH, ONEL,ONEL,EIGH,
C       93: P4222       94: P42212      95: P4322         96: P43212
     $  ONE,HALF,QUAR, HALF,HALF,HALF, ONE,ONE,EIGH,   HALF,HALF,HALF,
CCP4 $ HALF,ONEL,QUAR, HALF,HALF,HALF, ONEL,ONEL,EIGH, ONEL,ONEL,EIGH,
C       97: I422        98: I4122      123: P4/mmm       139: I4/mmm
     $  HALF,HALF,QUAR, ONE,QUAR,QUAR, half,half,half,  half,half,quar,
CCP4 $ HALF,HALF,QUAR, HALF,ONEL,EIGH, HALF,HALF,HALF,  HALF,HALF,QUAR,
C      143:  P3        144:  P31       145: P32          146:  R3
     $ ONE,ONE,ONE,   ONE,ONE,THRD,   ONE,ONE,THRD,    THRD,THRD,ONE,
CCP4 $ TWTD,TWTD,ONEL,ONEL,ONEL,THRDL,ONEL,ONEL,THRDL, TWTD,TWTD,THRDL,
C      147:  P-3       148:  R-3       149: P312         150:  P321
     $ twtd,twtd,half, twtd,twtd,sixt, ONE,ONE,HALF,   ONE,ONE,HALF,
CCP4 $ TWTD,TWTD,HALF, TWTD,TWTD,SIXT, TWTD,TWTD,HALF, TWTD,TWTD,HALF,
C      151: P3112      152: P3121      153: P3212        154: P3221
     $ ONE,ONE,SIXT,    ONE,ONE,SIXT,   ONE,ONE,SIXT,   ONE,ONE,SIXT,
CCP4 $ ONEL, ONEL,SIXT, ONEL,ONEL,SIXT, ONEL,ONEL,SIXT, ONEL,ONEL,SIXT,
C      155: R32        162:  P-31m     164: P-3m1
     $ THRD,THRD,HALF, twtd,half,half, twtd,thrd, one,
CCP4 $ TWTD,TWTD,SIXT, TWTD,HALF,HALF, TWTD,THRD, ONE,
C      166:  R-3m        168:  P6
     $ twtd,twtd,sixt,  ONE,HALF,ONE,
CCP4 $ TWTD,TWTD,SIXT, TWTD,HALF,ONEL,
C      169:  P61       170:  P65       171:  P62         172:  P64
     $  ONE,ONE,SIXT,  ONE,ONE,SIXT,   ONE,HALF,THRD,  ONE,HALF,THRD,
CCP4 $ ONEL,ONEL,SIXTL,ONEL,ONEL,SIXTL,ONEL,ONEL,THRDL,ONEL,ONEL,THRDL,
C      173:  P63       175:  P6/m      177: P622         178: P6122
     $  ONE,ONE,HALF,  twtd,twtd,half,  ONE,HALF,HALF, ONE,ONE,TWLT,
CCP4 $ TWTD,TWTD,HALFL, TWTD,TWTD,HALF,TWTD,HALF,HALF, ONEL,ONEL,TWLT,
C      179: P6522      180: P6222      181: P6422        182: P6322
     $ ONE,ONE,TWLT,   ONE,HALF,SIXT,  ONE,HALF,SIXT,  ONE,ONE,QUAR,
CCP4 $ ONEL,ONEL,TWLT, ONEL,ONEL,SIXT, ONEL,ONEL,SIXT, TWTD,TWTD,QUAR,
C      191: P6/mmm     195: P23        196: F23          197: I23
     $ twtd,thrd,half,  ONE,ONE,HALF,  ONE,HALF,HALF,  HALF,HALF,ONE/
CCP4 $ TWTD,THRD,HALF, ONEL,ONEL,HALF, QUAR,QUAR,ONEL, ONEL,ONEL,HALF/
      DATA ((ASULIM(II,JJ),II=1,3),JJ=74,NUMSGP)/
C      198: P213       199: I213       200: Pm-3         202: Fm-3
     $ HALF,HALF,ONE,  HALF,HALF,ONE,  half,half,half, half,half,quar,
CCP4 $ HALF,HALF,ONEL, HALF,HALF,HALF, HALF,HALF,HALF, HALF,HALF,QUAR,
C      204: Im-3       207: P432       208: P4232        209: F432
     $ half,half,half, HALF,HALF,ONE,  ONE,HALF,HALF,  HALF,HALF,HALF,
CCP4 $ HALF,HALF,HALF, ONEL,HALF,HALF, HALF,ONEL,QUAR, HALF,HALF,HALF,
C      210: F4132      211: I432       212: P4332        213: P4132
     $  HALF,THRQ,TWTD, QUAR,THRQ,TWTD, ONE,ONE,ONE,   ONE,ONE,ONE,
CCP4 $ HALF,ONEL,EIGH, HALF,HALF,QUAR, ONEL,ONEL,EIGH, ONEL,ONEL,EIGH,
C      214: I4132      221: Pm-3m      225: Fm-3m        229: Im-3m
     $ half,onel,eigh, half,half,half, half,quar,quar, half,half,quar/
CCP4 $ HALF,ONEL,EIGH, HALF,HALF,HALF, HALF,QUAR,QUAR, HALF,HALF,QUAR/
C
O
Contour levels
(September 2001)
Given a 'effective resolution' of the data, at what contour one has
to examine the mixed fourier synthesis map (2Fo-Fc & Fo-Fc)?
Is there any relation between resolution, completeness and contour?
Here's the plainly-practical answer:
The simple answer is that you want to contour at a level that gives the
clearest view of the density. I normally contour 2Fo-Fc & Fo-Fc at 1 and 3
sigma, respectively, but in some parts of the map you want to lower the
contour level. Your density will most likely not be equally strong throughout
the map due to variations in B-factor or missing strong low resolution terms,
so you'll have to adjust contour levels. If you lower the contour level too
much you'll be blinded by all the noise features. Just use your eyes to tell
what works best.
Then came a posting with some remarks, which sparked off a deep discussion about
validity and statistics:
- The sigma level of an Fo-Fc is meaningless. In the early
stages (poor and incomplete model), a 2-sigma feature
may be genuine, whereas near the end of the refinement
process (when the difference map is hopefully flat
except for noise) even a 5-sigma peak need not be.
- If you cut out maps around your molecule and then use
them in O, the "sigma level" is recalculated by O. As
a consequence, this level will almost always be lower
than the sigma level in the asymmetric unit, and features
will show up at deceptive levels (e.g., a "2-sigma"
peak may be just a 1-sigma noise feature). [This problem
does not occur when you use the good old map_* commands.]
- You want to be careful with going to too low a contour
level. For an example of the dire consequences that
can have, see
Nature
Structural Biology 8 (8), pp. 663-664 (2001) (you will need your nsb password to read the
actual text) ... [If you need convincing, check the real-space
fit and the map for 1F83 (chain B and C) at the
Uppsala Electron-Density Server]
A practical summary of this discussion:
I think in practice everybody is doing the same thing. You DO look at
5 sigma peaks just as you look at outliers in the Ramachandran plot, too close
contacts etc. Not because these must be errors, but because they are
suspicious and you want to visually make sure that they are not errors or to
fix them. Yes, a five sigma peak in a "perfect" map with very low rms in terms
of e/A**3 is meaningless but since the rms of the map is based on
statistics, these will be extremely rare. What I would recommend is to use a
peaksearch of the Fo-Fc map and look at the peaks sorted by peak hight.
Starting at the strongest peak work your way down until you have had a whole
row of peaks that you feel are not telling you anything. Important: don't
forget to look at the biggest negative peaks. A -5 sigma peak is just as
suspicious as a +5 sigma peak.
Wrt to putting a water in any >3sigma peak, this should clearly not be done.
Interpreting density means you want to find a CHEMICALLY PLAUSIBLE explanation
for any density feature. For a water that means that it should have at least
one decent hydrogen bond with the protein and no too close contacts. You
should always judge both density and "geometric/energetic sensibility" and if
your density is poor you want to give more "mental weight" to the geometry.
In many cases you will end up in the situation where you have the feeling
that the difference density does indicate a problem but you can't figure out
how to interprete it in which case you better leave it alone. Really the
perfect model doesn't exist, you just want to get as close to it as possible
given your data quality. Try never to overinterpret your density since others
that look at the structure without seeing the density will blindly believe
what you have built even if they shouldn't.
Please have a look at a
long summary of this hot discussion
and some of its follow-ups. At least one very practical point can be found there:
At what level should one contour a
difference map ? Well, one trick that may be useful is to leave out a
well-defined atom (e.g. a carbonyl oxygen) in the map calculation and adjust
the Fo-Fc contour level until that density looks just as good as the 2Fo-Fc
density for the same (missing) atom. Then you know that well-ordered entities
with ten-or-so electrons should have similar density features in both maps.
This is completely general. When it comes to water molecules in particular,
obviously one should use other criteria as well (plausible hydrogen-bonding
partners, refine to reasonable B-factors, possess acceptable 2Fo-Fc density
after refinement).
Then a purely statistical approach:
Speaking from a statistical point of view, a couple of points are worth
making on the subject of calculating the standard uncertainty (SU) of the
electron density (or difference density). Programs actually calculate the
RMS deviation from the mean of the electron density. The question is, under
what conditions is this an unbiased estimate of the SU ? - this is really
what we are interested in if we want to judge the significance of peaks (or
troughs) in the density. The answer is that the following conditions should
apply:
- The sample of density points used must be independent, for example 2 or
more of the points used should not be related by the space-group symmetry.
This is pretty self-evident, nevertheless most programs which purport to
compute the RMS as an estimate of the SU violate this condition! FFT does it
correctly since by default it always computes exactly one asymmetric unit (or
should do!). However when you "extend" the a.u. to cover the volume of
interest, the chances are that some points will have symmetry mates in the
extended map. The correct procedure would be to simply use the value of the
RMS originally computed by FFT.
- The sample of density points used must either be the entire population or
a random sample of it. Again the same argument as above applies here: it is
clearly not valid to use the RMS value for a selected non-random portion of
the a.u. as an unbiased estimate of the SU.
- The sample of density points used must truly represent the "noise". The
computed density will almost always include some of the "signal" we are
looking for (of course this will always be true in a Fo or 2Fo-Fc map, and
true for a Fo-Fc map except at completion of the structure). Therefore
ideally the points containing signal+noise should be excluded from the
calculation - for difference maps this can be done by using only the linear
portion of the normal probability plot close to the origin to estimate the
SU, and excluding the curved portion which should mostly represent the signal
(assuming of course that the noise really does have a normal distribution).
This method only really works well if the map is mostly noise with a small
amount of signal - so it can only be used for difference maps.
How much effect these corrections will have on the estimate of the SU will
depend obviously on the ratio of the volume of the map used to that of the
a.u., and the ratio of the number of points containing some signal to those
containing only noise.
Then, to round it off, some sound theoretical background:
The remarks below may still be
of some help in pointing out that basic statistics cannot be ignored, even
by those who do not love them, in the discussion of this question.
It would seem that the 'central' concept behind this discussion is the
Central Limit Theorem. If the lack of fit between Fo and Fc is randomly
distributed without any trends nor correlations, the Fo-Fc map will be made
up of white noise, i.e. its values will be normally distributed, so that the
probability of a 5-sigma deviation will be less than 10**(-6). If the number
of data is so vast that there are of the order of 10**6 independent data
items or more, then a 5-sigma peak can occur by chance and hence be considered
as noise. In more commonplace cases, however, the probability of a 5-sigma
peak occurring by chance would be quite low, and therefore such a peak would
be highly significant, as stated before.
GK's counterexample, with which AL disagreed, does seem rather contrived.
If 10 times the sigma of the Fo-Fc map were to be considered as noise by some
criterion, then the same criterion should lead one to conclude that the data
have been grossly overfitted in the first place.
REJECT in SCALEPACK2MTZ
(January 2001)
I wanted to exclude a few reflections from my data-file using the
REJECT flag in "scalepack2mtz". However, the reflections are kept
in the output file. What can I do?
Here a summary of useful hints to the REJECT problem in SCALEPACK2MTZ:
- This was indeed a bug. It has now been fixed in the CCP4 Suite version
of the program.
- There is no other CCP4 program to exclude
selected reflections after processing (for some good reasons).
- Use SFTOOLS with the following input:
   SELECT index h = 1
   SELECT index k = 10
   SELECT index l = 10
   SELECT INVERT
   PURGE
   YES
Using the following awk-script then gives the expected result which can
easily be included into an input command file for SFTOOLS:
   awk '$7=="30.0000" {printf"SELECT index h = %3s\nSELECT index k =
%3s\nSELECT index l= %3s\nSELECT INVERT\nPURGE\nYES\n",$1,$2,$3}' fft.log
Real space difference map
(January 2001)
I'd like to compute a difference map, problem is
that one dataset is in C2221 and the other in P63.
I guess there's no way to do a difference fourier
(Fo-Fo). But it should work in real space.
How do I calculate a real space difference map?
- You need to calculate maps in both space groups. Then mask the density for
each with a mask from the model:
NCSMASK XYZIN model.pdb MSKOUT model.msk
- Then you will need to convert them to the same grid.
MAPROT will do that - it is a bit complicated but there is an example.
- Then MAPMASK or OVERLAPMAP can be used to "add" the maps applying
a scale of -1.0 to one. MAPMAN can also be used for this procedure.
An alternative to step 1 and 2 may be to use MAVE option IMP, after which MAVE
or MAPMASK should be used to cut out density inside a mask and "skew"
it into position in the second cell.
Non-proline cis-peptide
(April 2001)
when I refine my structure, I can definitely see a cis peptide
bond between proline and histidine. (it is very obvious from the
2fo-fc.map at R=17.1% and Rf=19.1%). This is a non-proline cis
peptide because it is formed by CO of proline and NH of histidine.
I am using CNS to refine the structure, and I changed the name of
proline and defined the bond and dihedral parameters in the toppar
files for this peptide bond, but it seems not successful in the map.
It has not put the N atom to the density it should be.
Does anyone have experiences on the refinement of non-proline cis
peptide bond, or know how to deal with it? And where can I find the
bond and dihedral parameters for non-proline cis peptide bond?
Summary from the enquirer:
- Many people suggested using REFMAC5 becasue it can do it automatically.
- Some people gave the toppar parameters to handle the situation, and some people
even kindly provided their toppar files.
Even though this is not a CNS Newsletter, the various answers give food for
thought, so a transcription is presented here:
The most common answer is (with variations in parameters, as indicated):
- Create a new file cis_peptide.param, similar to one you can get out of the script
cis_peptide.inp (see below) and read
this parameter file in refinement ".inp" file, as follows:
{* parameter files *}
{===>} parameter_infile_1="CNS_TOPPAR:protein_rep.param";
{===>} parameter_infile_2="CNS_TOPPAR:water_rep.param";
{===>} parameter_infile_3="CNS_TOPPAR:ion.param";
{===>} parameter_infile_4="cis_peptide.param";
The param file would look like this:
 parameter
    dihedral
       (name ca and resid $res1) (name c and resid $res1)
       (name n and resid $res2) (name ca and resid $res2)
       1250. 2 180.
 end
This defines a cis-peptide between residues $res1 and $res2.
- A value of "5." instead of "1250." was suggested by one user.
- Another suggestion is to put the lines from the cis_peptide.param file directly into
the file 'refine.inp', in the following position:
____________________________________________________

   structure @&structure_infile end
   coordinates @&coordinate_infile

 end if

<<<< put statement here!


 xray

   @CNS_XTALLIB:spacegroup.lib (sg=&sg;
                                sgparam=$sgparam;)


____________________________________________________
- For two molecules in the ASU, the param would be:
parameter
 dihedral ( name ca and segid "A" and resid $res1 )
          ( name  c and segid "A" and resid $res1 )
          ( name  n and segid "A" and resid $res2 )
          ( name ca and segid "A" and resid $res2 )
          1250.0 1 180.0
end

parameter
 dihedral ( name ca and segid "B" and resid $res1 )
          ( name  c and segid "B" and resid $res1 )
          ( name  n and segid "B" and resid $res2 )
          ( name ca and segid "B" and resid $res2 )
          1250.0 1 180.0
end
Please note the value of "1" instead of "2" (is this significant?).
- For refinement in CNS you have to have an extra parameter file
which looks something like:
 parameter
     angl (name CA and resid $res1) (name C  and resid $res1)
          (name N  and resid $res2)
     485.856     119.700

     angl (name C  and resid $res1) (name N  and resid $res2)
          (name CA and resid $res2)
      599.823    127.800

     angl (name O  and resid $res1) (name C  and resid $res1)
          (name N  and resid $res2)
     759.150     120.600


     dihe (name CA and resid $res1) (name C  and resid $res1)
          (name N  and resid $res2) (name CA and resid $res2)
     1250.0      2    180.0
 end
- If you're using TOPPAR/protein.top and TOPPAR/protein_rep.param files,
the easiest way may be to modify the protein_rep.param as below
(add last 4 lines). You don't need to define a special residue for cis-pept.
{ very tight/rigid dihedrals }
dihe X    C    NH1  X     $kdih_rigid   1     0.0 ! omega torsion angle and ARG...
dihe CH1E C    N    CH1E  $kdih_rigid   2   180.0 ! allow cis PRO
dihe CH2E C    N    CH1E  $kdih_rigid   2   180.0
dihe CH2G C    N    CH1E  $kdih_rigid   2   180.0

dihe CH1E C    NH1  CH1E  $kdih_rigid   2   180.0 ! allow cis Pept
dihe CH2G C    NH1  CH1E  $kdih_rigid   2   180.0 !
dihe CH1E C    NH1  CH2G  $kdih_rigid   2   180.0 ! cis GLY
dihe CH2G C    NH1  CH2G  $kdih_rigid   2   180.0 !
Large beta-angle in C2
(May 2001)
DENZO suggested a C2 cell with a = 143 b = 63 c = 94 beta = 130.
Did anybody else observe such a large beta angle before in a protein crystal
with a monoclinic cell?
- C2 cells often have this crazy angle. If you do an HKLVIEW plot of the
hnl layers you can often see a more "sensible" set of reciprocal lattice
vectors, with beta nearer 90 degrees, but they will require that you use
a non-standard space group such as I2.
In other words: the beta isn't biologically relevant, but it serves to predict all
your spots.
- There are about 3 dozen entries in the PDB with space group C2
and a beta angle > 130 degrees. The highest beta angle of all
PDB entries occurs for 1SPG:
CRYST1 89.600 75.600 69.700 90.00 141.90 90.00 C 1 2 1 4
However, a look at the WHATIF output for a few of these
suggests there may be spacegroup problems or pseudo-symmetry for several of these entries
(e.g.: 1spg-notes).
Reflection vanishing act
(February 2001)
Yesterday I realized that I lost about half of my reflections in SHARP.
Today I am looking for half of my reflections after converting CNS to mtz
using f2mtz. It appears that every second reflection is simply missing???
Here is my script:
f2mtz \
        hklin hla.hkl \
        hklout  cbs_hla.extern.mtz \
        < f2mtz.log
CELL 144.524  144.524  108.161   90.000   90.000  120.000
SYMM P31
FORMT '(1X,3F6.0,6f10.3)'
LABO H K L FP SIGFP HLA HLB HLC HLD FOMcns
CTYPO H H H G L A A A A W
END
eof
First summary from the enquirer:
It's neither the different AU nor the Friedel pairs nor the multiple
line output from CNS but seems to be a read "feature" in F2MTZ.
Anyway, including a blank line at every second line in my "free-format"
data set gives me my complete "MTZ" data set.
But... this needed an update:
My previous summary was a little bit too early. The real bug was in the
input script which was reading one item more than previously declared.
F2MTZ thus kept reading also the next line and obviously gets
troubles at the next line. This way, every second line was missing
one variable while every second but one line was disappearing.
So: Declare as many variables as you want to read - obviously.
Structure family
(May 2001)
I have resolved a new structure recently. How can I know whether it belongs
to a new family or a family which have existed in SCOP?
The suggestions are visiting the following sites:
Related sites and servers:
(see: Practical
"Structural Databases")
Stereo net
(May 2001)
In the distant past I remember using a stereo net to measure the angle
between different self-rotation peaks. Can anyone suggest where/how to
get hold of one again?
GETAX
(June 2001)
Why does getax complain "map not EXACTLY one cell" and how to fix it?
Summary from the enquirer:
Mapmask run with either
- explicit grid limits:
0 Xlim-1 0 ylim-1 0 zlim-1
- XYZLIM CELL
I tried both and now getax runs.
How to combine phases from various sources
(June 2001)
I have many datasets for a protein from various sources, including
MAD, SIRAS and MIR from different derivatives. Some of them are
not isomorphous. I am just wondering whether there is any way by which I
could refine and phase all of these derivatives in one single run of
MLPHARE? (One problem is that I can't define different "natives" for
different datasets, which I believe is necessary). If I can't do that,
what's the best way to combine all of those phases from various sources? I
know sigmaa can combine two sets of MIR phases. Is there any other program
which can do this? and anything I ought to know for optimizing phase
combination?
Summary from the enquirer:
- The simple easy method that works is just to write out the H-L
coefficients for each individual refinement. Then simply add them up
using SFTOOLS. The HL coefficients (phases) are very robust and
non-isomorphism bothers them very little.
- You can try to run SOLVE, using the combine script !
- I don't know if it will be easy for you to install SHARP in your computer
but I guess this is one of the best programs available for phasing. You
will just need heavy atom coordinates from each dataset and the datasets
themselves. It will take a while to combine phases from all datasets but I
am almost sure they (phases) will be reliable.
- If you believe you need different native datasets to combine with your
various derivatives, then you can't come up with one set of phases. Try to
work with different subsets that each are sufficiently isomorphous. If one
subset gives phases of adequate quality your problem is solved. If not,
you could consider multiple crystal averaging across the maps derived from
the various data subsets.
- Use dm_multi after sperately phasing your 'natives'.
Since most are more or less isomorphous, start
from a unity matrix and let it refine.
- In the end you have to choose a master data set which you want to
phase, and phase that.
So the way I would proceed:
- First make sure all our sites are as close to the origin as possible -
that minimises the effect of cell differences.
- Then use native1 with derivatives 1H1, 1H2, etc, to refine the 1H1, 1H2,
..... sites and get ISOE1 ANOE1.
- Use native2 with derivatives 2H1, 2H2, etc, to refine the 2H1, 2H2, ...
sites. You want to use these sites, but get better estimates of ISOE2. ( ANOE2
wont change..
- So I would do one or two cycles of refinement of each of 2H1, 2H2, etc
against native1, just to get the ISOEs and maybe let shift the
coordinates a bit but not the occupancies.
- Then do a final phasing run with all the derivatives v native1.
In one case where we had awful non-isomorphism we could only get useful
information to quite low resolution for the second set.
An alternative is to just add the HLA1 HLB1.. to HLA2 HLB2.. in Sigmaa
but that takes no account of weighting the non-isomorphism.
Another way would be to use the two sets for multi-crystal averaging.
See Kevin Cowtans web pages
for a lecture where he has some discussion of this.
Molecular Replacement with Zn2+ as anchoring point
(July 2001)
Our protein contains two zinc ions for which we are able to pick up
the signal. However, the phasing power is too low to solve the structure.
With MR we also failed because the search model is less than half of
the molecule with about 30% sequence identity but also containing two zincs.
Is it possible to use the zinc ions as an anchoring point and rotate the
search model around this axis?! Which program will do so?
Summary from the enquirer:
- Hmmm - you lose the chance to use FFT search functions then.
Best to verify your solutions by checking the Zn positions are consistent.
- Run SOLVE, RESOLUTION_STEPS 3 from let's say 20 to 4Å.
Then run molrep in combination with those phases.
- Ask Renaud Morales at IBS. We published
a paper concerning such an operation. Rotation about an axis defined by 2 Fe
sites in that case. Note that you must place the model in two opposite
positions, i.e. + direction and - direction, and carry out the
search. Monitoring is with Rfree, and you eliminate all solutions with bad
packing.
- In the old XPLOR/CNS you could specify your rotations
explicitly and I guess that is still true. You'll have to find out the
direction of your rotation and then rotate around it in let's say 2.5 degree
steps.
An alternative is to generate the set of models yourself and use each one of
them for a translation search in for instance amore. This will require
a bit of scripting but could be more sensitive.
The real question is whether a successful solution of this problem is going to
give you an interpretable map. At < 30% identity and only 50% of the full
structure I think that's going to be tough.
- Did you try soaking a crystal in EDTA to remove the Zn, and
generate a set of isomorphous differences that way? It's
worked for me.
And if you do the rotation search, don't forget you need to consider
the two cases of ZnA from your model superimposed with Zn site 1
and site 2 from your data.
- If you want, I can try EPMR followed by SHAKE&WARP to
salvage a weak solution. we rebuilt complete structures from
less than 50%, but admittedly from reasonable models and
decent data.
- I had the same problem with a structure I am working on right now.
I can see two Ca2+ ions in the map but the solution does not give
good phases to solve the whole structure.
I agree with some of the others: use Se-Met or other heavy atom methods to
solve it.
- If your data is of fairly high resolution and quality, try direct
methods. In particular, try the new OASIS program in CCP4.
- Have you already tried to run MOLREP with your starting phases?
There's another program BRUTEPTF which sounds interesting.
NYSGRC
- If you could compute an electron density map with the Zn-derived phases
and the map is just good enough for you to identify the molecule boundaries,
you could try to get the approximate center-of-gravity of your own molecule.
In this way, you get three anchoring points and would, together with the two
zincs and the c-o-g of the model (could be easily found by a simple run of
MOLEMAN2), be able to determine the RT matrix by Site2RT in RAVE.
- Since you have only < 50% of a model, with 30% seq identity, MR is going to be
tough... Probably (or most likely...?) Randy Read's BEAST program will give you
better results than conventional MR programs, since it uses maximum likelihood theory
in its MR functions. At a workshop in Como last June, Randy presented some
promising figures on test cases, which were outstanding compared to results from
AMoRe, especially in non-trivial cases. Ask
Randy for program and details.
- We have found BEAST from Randy Read to find solutions when we all but lost
hope! If you want to go down the random search method, a simple automated method
would be to work out the rotations and translation to take your zincs to lie
along one axis (put a couple of points along this line and AMORE will do
this during its centre of mass calculations). Then simply apply an incremental rotation
around the axis (5 degrees around z if you do AMoRe), i.e. cycle = 0,
cycle_now=cycle + 1, rot_now=cycle_now x 5, in LSQKAB apply rot_now to your
centred model (which has had the same centre of mass centering rot and trans
as the zinc atoms in a line applied). Then add another LSQKAB which would
return the zinc atom line back to the correct position, this will move your
model to a point in the cell rotated around the two zinc atoms. You can then
test the model by some criteria (I would think packing first), then test it
by calculating R-factors or correlation coeffs. The longest part of the
whole business will be writing the script. My experience is that it almost
never works (partly because I only do stuff like this when things are
hopeless) but it's very satisfying to get the script running. I would use
BEAST or do phased translation searches.
Rfree vs resolution (complete with graph!)
(August 2001)
I think I have pestered you already once with this question.
Where was this elusive graph published of:
statistical expectation value of rfree (or so) vs resolution?
It looked somewhat like the Cruickshank Rfree vs DPI plot
if I understand the rumors correctly....
A freeR of 20 for a 3.5Å structure is probably as unlikely as
a freeR of 29 for a 1.2Å structure and both warrant some
explanantion....
And just to heat up the flames: I think freeR was probably the
single most significant contribution to put an end to DreamWorks
crystallography....almost.
I suspect you may be refering to one of these two papers:
- Tickle, I.J., Laskowski, R.A. & Moss, D.S. (1998). Rfree and the Rfree
ratio. I. Derivation of expected values of cross-validation residuals
used in macromolecular least-squares refinement. Acta Crystallogr. D54,
547-557 (find
the PDF version at Acta D).
- Tickle, I.J., Laskowski, R.A. & Moss, D.S. (2000). Rfree and the Rfree
ratio. II. Calculation of the expected values and variances of
cross-validation statistics in macromolecular least-squares refinement.
Acta Crystallogr. D56, 442-450.
Less likely (but a gripping yarn nonetheless ;-):
Kleywegt, G.J. & Brunger, A.T. (1996). Checking your imagination:
applications of the free R value. Structure 4, 897-904.
Find attached a plot of rfree versus resolution based
on ~6500 PDB entries. This is a box plot - in every
resolution bin (from the bottom up) the 10th percentile,
25th, 50th (i.e. median), 75th and 90th percentile are
indicated; outliers below 10 and above 90 are shown
individually as small specks. The linear correlation
coefficient is +0.56 (figure from: gjk & ta jones,
to be published (2001, if I have time)).
Your remarks about certain Rfree warranting explanation is absolutely true.
This is also borne out by the attached plot.
| Well, here it is (click on thumb-nail to enlarge): |
 |
Trouble interpreting self-rotation
(August 2001)
I have a triclinic crystal of which structure can (hopefully...)
be solved by molecular replacement. According to matthews-coef, the protein is possibly
a hexamer(3.0) or an octamer(2.3). Gel filtration specified it's a hexamer.
The problem is that I can't imagine the NCS point group by looking
at the self-rotation map. It has strong peaks at chi=180, 146.7, 119,
and 70.9. I could find 8 peaks at chi=180. The map is attached. Click on the
thumbnail to enlarge.
Can someone help me to understand the possible spatial arrangement
of this multimeric protein?
I have one more question:
According to Schroder et al. (Structure, 2000, 8(6):605), they
created 3,600 search models from the interpretation of self-ratation
map and solved the structure by MR. How can one create such large
numbers of probes? |
 |
Your MOLREP self-rotation map would suggest to me that you have
two tetramers with 222 point group symmetry in your triclinic cell.
These are related by a two-fold NCS axis (MAIN DYAD)
located at phi=45, omega=90 for which the rotation function value
is higher (RFmax = 5691) than other dyads peaks (Chi=180), which
relate dimers in the tetramers and also odd peaks at Chi=70.8,
Chi=120 and Chi=146.7 (RFmax about 2000) which relate dimers of the
two tetramers which are not related by the MAIN DYAD.
Yes we have generated all 36 hundred decamers in the above paper using
relatively simple C-shell script and a bunch of CCP4 programs.
I can send you this script and a script to grep and analyse the
solutions if you are interested.
Note on CCP4BB 'rules'
At the end of a long discussion on what a CCP4BB posting should or should
not contain (including flaming, spelling and grammatical errors and
anonimity), the following information was sent from CCP4:
Order in which to approach a problem with a CCP4 program (or related
queries):
- RTFM
including CCP4 manual, HTML docs and tutorials (in CCP4i etc),
newsletters, study weekend proceedings.....
- ask your more experienced labmates
and maybe even your supervisor, if you dare
- read the source code (and isn't it great that this is possible?)
:) may the force be with you
- ask the BB
The procedure outlined is an excellent one. I would only make a
small addition - you can also email CCP4 staff at DL - but if it's a
question on general usage etc. we prefer these go to CCP4BB as they are of
a more general interest (the address for CCP4/dl staff is below. As far as
abuse goes it's unfortunate, as someone has shown, how easy it would be to send such
messages anonymously - but I'm sure the 1900 people subscribed to CCP4BB
appreciate the near open forum and also have better things to do!
Here is what every new user of the CCP4BB
is greeted with:
     *** Welcome to the general CCP4 bulletin board 'ccp4bb' ***

 If you wish to send messages to this bulletin board then send them to
 ccp4bb@dl.ac.uk. Any crystallographic related item is acceptable, not
 necessarily directly related to CCP4, for example: problems, job adverts
 and requests for information.

 Unacceptable content includes personal messages and abuse, and messages of
 an unrelated commercial nature.

 To prevent abuse of the mailing list only members of the list are able to
 post to it. This is done by checking the email of the sender against the
 email addresses of the members of the list; please check that you are
 sending messages from the same address with which you have subscribed.

 CCP4 reserve the right to remove addresses from the list without notice if
 they have persistent delivery problems.

 To unsubscribe from the mailing list send the message
       unsubscribe ccp4bb
 to majordomo@dl.ac.uk. Any requests about the lists, for example for help,
 should also be sent to majordomo.

 Etiquette:
 1. Always write messages in plain ASCII: attachments and/or encryption are
  not appropriate to this forum
 2. Please always add a short but descriptive Subject line
 3. Please post a summary of the replies you receive to ccp4bb, so that
  others may benefit

 More information about CCP4 can be found at
       http://www.dl.ac.uk/CCP/CCP4/main.html
Announcements
HIC-Update
(January 2001)
HIC-Up, the Hetero-compound Information Centre - Uppsala,
has been updated and now contains information on 2,971
hetero-entities that have been taken from the PDB (up
from 2,640 in July, 2000).
The URL for HIC-Up is:
http://xray.bmc.uu.se/hicup.
(September 2001)
HIC-Up, the Hetero-compound Information Centre - Uppsala,
has been updated and now contains information on 3,296
hetero-entities that have been taken from the PDB.
For URL, see above.
RAVE (MAPMAN, etc.) for LINUX
(January 2001)
In Uppsala: if you use the "run"-script, just type things
like "run mapman" etc. on your Linux box.
Elsewhere: you can download RAVE for Linux from xray.bmc.uu.se,
directory pub/gerard/rave, file rave_linux.tar.Z (or the
individual programs from directory rave_linux). Check
Uppsala Software Factory
and
'FTP Links'
for help with download.
CCP4 v4.1
(30 January 2001)
     #########################################################
     #                                                       #
     #                   The CCP4 SUITE                      #
     #                                                       #
     #              -Computer Programs for                   #
     #            Macromolecular Crystallography             #
     #                                                       #
     #                     VERSION 4.1                       #
     #                                                       #
     #########################################################


                      ------ OUT NOW ! ------
Further details on obtaining the
Suite can be found on the
CCP4 web site.
CCP4 v4.1.1
(2 March 2001)
The Daresbury ftp server has been updated to patch release 4.1.1.
Relative to 4.1, this release contains some fixes to problems discovered
in 4.1. If you have successfully installed 4.1 and
none of these problems is relevant to you, then there is probably no
point in updating.
If you want/need to update, then there is a
global patch file
provided, but note that this will not patch
any binary files e.g. images or .class files) - otherwise it should be
safe to take individual files.
MOSFLM - release of version 6.11
(March 2001)
I have put a new version of Mosflm on the
lmb anonymous ftp server
(can also be accessed through
Harry's Personal Pages).
MOLREP 7.0
(March 2001)
New version of MOLREP (MOLecular REPlacement program) (7.0) is now
available (beta release) from
ALExei.
Or use york's ftp
ftp ftp.ysbl.york.ac.uk
login anonymous
cd pub/alexei
get molrep7.tar.gz
After gunzipping and untarring follow instructions in README.
ACORN in CCP4
(March 2001)
A test CCP4 version of ACORN is available now. ACORN is a flexible and
efficient ab initio procedure to solve a protein structure when atomic
resolution data is available and has already solved at least 4 protein
structures with the size from 125 to 350 amino-acid residues.
To obtain the program:
ftp ftp.ysbl.york.ac.uk
login: anonymous
password:your full email address
ftp > cd pub/yao
ftp > get acorn.f
ftp > quit
The document for ACORN is at:
Yao's ACORN documentation.
More tutorials for SFTOOLS etc.
(March 2001)
In case there are users of my old web pages that haven't found the new site, here is the
MMI Crystallography Home Page.
Other tutorials of interest (Data collection, and heavy atom binding) can be found on the
higlights page.
Honorary Doctorate for Eleanor
(April 2001)
| As you can (or cannot - depending on how good your Swedish
is) read in the attached newspaper clipping from last
Saturday's "Upsala Nya Tidning", Eleanor Dodson will
receive an honorary doctorate from Uppsala University
this Spring. Congratulations, Eleanor! |
click to enlarge |
(July 2001)
It is our pleasure to announce that Eleanor Dodson has
been promoted to personal chair at the University of York.
Since the end of May 2001 she has changed from 'Mrs. Dodson'
through 'Dr. Dodson' (from the beginning of June 2001, as
announced earlier on this bb by DVD), to 'Prof. Dodson'
from now. But thankfully she will always be Eleanor!
Our warmest congratulations on what many of us who know her,
have felt was due a long time ago, and what many others have
thought was true already anyway (judging by the mail she
receives).
cctbx - Computational Crystallography Toolbox
(May 2001)
-----------------------------------------------------
          First general release of the

      Computational Crystallography Toolbox

          http://cctbx.sourceforge.net/
-----------------------------------------------------
AutoDep 3.0 at EBI
(May 2001)
*** Announcement of AutoDep Version 3.0 at EBI ****
A new version of AutoDep at EBI for PDB Submissions, will become
available on Tuesday 8th May at the EBI, via URL
autodep.ebi.ac.uk.
This version is designed to support Harvest/Deposition file
information from CCP4 (SCALA, TRUNCATE, REFMAC) and from the CNS
programme suite. The information from Harvest files can be merged,
resulting in quicker deposition.
For some further details see
Announcement of version 3.0.
New Version of PDB mode for Emacs
(June 2001)
pdb-mode is a major mode for the GNU-Emacs/XEmacs editors, providing
editing functions of relevance to Protein DataBank (PDB) formatted
files. This includes simple ways of selecting groups of atoms and
changing attributes such as B-factor, occupancy, residue number, chain
ID, SEGID etc.
See Charlie's scripts
for more info.
PyMOL v0.56 (+ Windows Installer)
(July 2001)
PyMOL v0.56 has been released at
Sourceforge.
Updated Tcl/Tk/BLT on CCP4 ftp server
(September 2001)
After recent (entirely justified!) complaints about the pre-built
Tcl/Tk/BLT executables on the CCP4 ftp server, I have rebuilt the IRIX
and OSF1 binaries and also added a new webpage to the relevant ftp
directory.
Please ignore this message if you are already happily using Tcl/Tk 8.3
and BLT 2.4 on your system, since the source code has NOT been updated.
Otherwise you can pick up the packages by accessing
ftp://ccp4a.dl.ac.uk/pub/ccp4/tcltk/README.html
and following the appropriate link (alternatively you can connect
directly via anonymous ftp to the server).
 Newsletter contents...