Laboratório Nacional de Luz Síncrotron – CBME - CPR
Caixa Postal 6192 - Campinas - SP - CEP 13084-971
brandao@webcom.com
Abstract. X-ray diffraction is a technique that allows access to 3D structure of crystalline materials. In the cases in which it is possible to obtain protein crystals, diffraction studies are performed in order to obtain their 3D structures. As data collection techniques evolve, it is necessary to include more details to correctly model the experiment. At the Protein Crystallography Beamline at LNLS, the Brazilian National Synchrotron Source, X-ray experiments are performed at beam energies which enhance the absorption by the crystal, and decrease data quality introducing systematic errors in the recorded intensities that emerge from crystals. It is highly desired to establish a protocol that enables absorption correction for diffraction experiments. Absorption correction can be calculated by direct integration of a scalar function throughout the crystal volume, and the definition of the scalar function remains as the key issue in this kind of problem. This work presents the results for an automatic procedure to obtain the integrand function, as well as the main qualitative aspects of absorption effects, simulated in 2D protein crystals that present physical properties similar to the real crystals used in experiments.
Keywords: X-ray diffraction, absorption correction, protein crystallography.
1. INTRODUCTION
Proteins are the basic units of living organisms and can be extracted from natural materials (e.g. seed grinding), or more recently by expressing them in microorganisms. It can take months to years to establish the process, which results in protein solutions and is the key to obtain protein crystals.
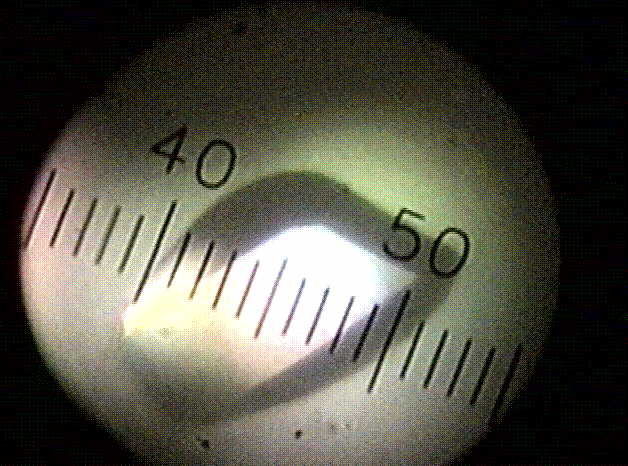
The protein crystallography beamline at LNLS is running since 1998 (Polikarpov, Oliva et al, 1998), allowing researchers to collect X-ray diffraction data from protein crystals, in the range between 8keV and 12keV. Protein crystals (Fig. 1) are grown in crystallization experiments performed with concentrated protein solutions.
Figure 1 – Hen egg white lysozyme crystal (0.03mm/div).
Protein crystals are difficult to grow and sometimes are not found in big number, therefore it is necessary to collect the best data sets from the fewest experiments. X-ray diffraction experiments with protein crystals can be refined by including absorption correction schemes for the X ray absorption in the crystal.
Comparing with inorganic molecules crystals, organic macromolecular crystals present much less X-ray absorption, and this is the reason why at first X-ray absorption wasn't taken into account, though there always there were absorption correction studies (de Meulener and Tompa, 1965; de Titta, 1984; Maslen, 1995). The correction for this effect is important for protein crystallography when it is necessary to observe anomalous differences in diffraction patterns, in order to obtain phases for 'ab initio' structure determination.
3. X-RAY ABSORPTION
This section states the X ray absorption interactions, and places its importance inside the protein crystallography area. Firstly it is presented an overview, followed by the absorption aspects important in diffraction experiments and the description of the evaluation method.
3.1 Overview
The attenuation in the intensity of a monochromatic radiation beam that crosses an isotropic and homogeneous material follows the relation:
![]() (1)
(1)
where I0 is the initial intensity, I, the final intensity, m , the linear absorption coefficient, and T, is the distance traveled by the radiation while crossing the material. This expression holds for crystalline solids when subjected to X ray radiation in the range used in crystallographic experiments (Maslen, 1995).
From all the processes that can reduce the intensity of X-rays that traverse the materials, it must be highlighted the photoelectric effect, radiation scattering and extinction. Photoelectric absorption is the result from the interaction between the incident radiation and the atoms of the material, causing photons to be completely absorbed and electrons to be ejected from the atoms. Scattering happens in two ways: elastic scattering (Rayleigh) or inelastic scattering (Compton). Extinction can be modeled as the result from the elastic scattering added to the crystalline organization of the materials, which can increase or decrease the radiation intensity leaving the material.
Assuming that absorption is an additive phenomenon, it is possible to use the following relation for the linear absorption coefficient calculation (Maslen, 1995):
 (2)
(2)
where Vc is the volume of one crystallographic unit cell of the material, Nn is the number of n-type absorbing centers in this cell, and s n is the cross section for the n-th contribution.
The transmission coefficient TR for a volume V of material that is traversed by X-rays is given by (Maslen, 1995):
![]() (3)
(3)
where T is the path traversed by the radiation coming from outside the material and which leaves the material starting from a point inside the integrating volume. It is convenient to decompose T in two paths: the input path leading to the interior point and the output path from this point on. m is the linear absorption coefficient.
3.2 Protein Crystals and X-ray Absorption
Typical protein crystals are 0.1mm to 0.3mm big in their longest direction, reaching up to 1 mm long, and they can be seen as composed roughly by 60% of water (Blundell and Johnson, 1994). In Fig. 2 it is possible to see examples of crystalline morphology.
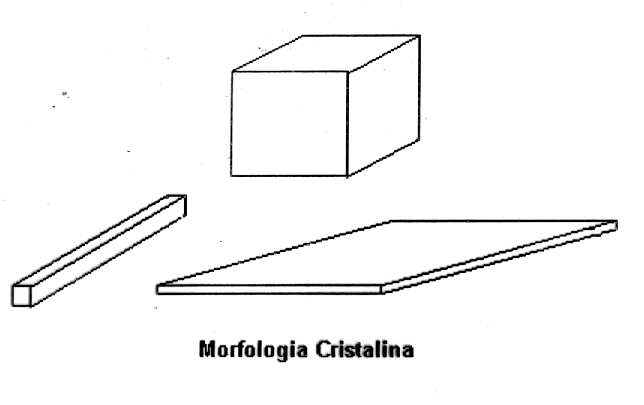
Figure 2 – Simplified crystalline morphology.
There are three basic types of protein crystals: rhomboedral crystals, plates and needles, and the longest linear dimension is taken as the reference to classify them. For this work, plates and needles are the most interesting for it is the difference in their dimensions that enhances the absorption effects, as it will be seen below.
Table 1 lists the values of m and for 1/m - the absorption length - for water, protein solutions and for air, when interacting with 1.4Å radiation.
Table 1. Absorption coefficients for materials at 1.4Å.
|
m |
1/m |
|
|
Air |
8.25 x 10⁻⁴ mm-1 |
1211 mm |
|
Water |
0.75 x 10⁻¹ mm-1 |
1.33 mm |
|
Protein Solution |
1.0 x 10⁻¹ mm-1 |
1.0 mm |
The absorption length tells one the path length that radiation should traverse inside the material until its intensity is reduced by 1/3 of its original intensity. X-rays for the protein crystals’ diffraction experiments are highly absorbed as they traverse paths in the range of 1 mm inside protein solutions. Since typical protein crystals’ sizes are about 0.1 mm, the absorption length indicates that attenuation shouldn’t be neglected for these crystals.
If protein crystals’ dimensions were similar in every direction, the effects of absorption differences would be small. Needle and plate crystals are very common, and this intrinsic characteristic may introduce differences in the diffracted intensities that are geometry-dependent, and it is interesting to calculate how much does the absorption effect affect the outgoing radiation.
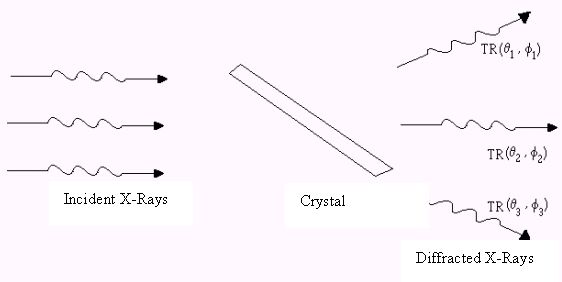
Figure 3 –Attenuation is geometry-dependent.
Figure 3 shows qualitatively that the diffracted radiation leaves the crystal with attenuation that depends on the direction (q ,f ). The crystal transmission coefficient, TR, is a function that depends on these variables. The angular dependence can be analyzed in terms of the crystal geometry and its orientation in relation to the incident radiation, and is calculated by the integral given in Eq. 3.
In the case of anomalous diffraction, the anomalous difference can be estimated for Bijvoet pairs (Hendrickson & Ogata, 1997) according to the following relation:
 (4)
(4)
where F is the measured structure factor, NT is the total number of atoms (excluding hydrogen atoms), NA, is the number of anomalous scatterers, fA, is the anomalous scattering factor for the anomalous scatterers and Zeff, is the effective scattering factor for all the light atoms.
In proteins Zeff=6.7 e- and NT=7.8Nres, where Nres is the number of residues in the protein. For the HEWL protein (Hen Egg White Lysozyme), the anomalous difference from sulfur atoms that are present in its structure is 0,8% under 1.4Å radiation, and if cesium atoms were placed in the structure, the anomalous difference would be 6%.
Assuming that the relation between structure factors F and measured intensities I is
 (5)
(5)
it is possible to conclude that the differences in the measured intensities would be 0,4% e 3% for sulfur and cesium respectively.
Taking into account that good anomalous differences experimental signals might be essential to obtain phases in ‘ab initio’ structure determination, these anomalous differences values will be used as standards in evaluating the necessity for absorption correction.
3.3 Absorption Coefficient Evaluation
For the sake of simplicity, this work will present the results for 2D crystals, without loss of generality, and the main features of absorption differences will be highlighted.
According to Eq. 3, the transmission coefficient is calculated by an integral, which can be approximated by (Abramowitz & Stegun, 1972, Carnaham, 1969):
 (6)
(6)
where TR is the transmission factor, V is the volume of the crystal, wi are gaussian weights, m is the linear absorption coefficient, and Tijk is the path traversed by the radiation when passing through the ijk-th point of the integration grid.
The absorption coefficient is calculated by:
![]() (7)
(7)
For the 2D case, Eq. 6 can be written as:
 (8)
(8)
where S is the area of the crystal, instead of the volume, and m and Tij are analogous to the ones in Eq. 6
4. SIMULATION AND RESULTS
Once the problem is stated, it is possible to simulate some representative cases, using typical constraints found in protein crystallography. In Fig. 4 it is possible to see the input radiation direction, the crystal and the output radiation direction.
Figure 4- Geometrical description of the simulation experiment.
The simulations were performed in order to highlight the absorption differences for different crystal geometries. In Fig. 4 it is shown a crystal with length l and height h, subject to radiation coming from the direction of ![]() and leaving the crystal in the direction of
and leaving the crystal in the direction of ![]() . The crystal is fully immersed in X-rays. Since this is a 2D problem, the output direction can be regarded as a function of the output angle,
. The crystal is fully immersed in X-rays. Since this is a 2D problem, the output direction can be regarded as a function of the output angle,![]() . This situation is equivalent to a rectangular cross-section cylinder.
. This situation is equivalent to a rectangular cross-section cylinder.
In the simulations, the input radiation was kept fixed, and it was made a scan for the output directions, resulting in a plot of absorption versus output angle for each of the tested crystal dimensions. To validate the procedure adopted for the rectangular 2D crystals, the algorithm was tested for a crystal with dimensions comparable to the dimensions of tabulated absorption factors for cylinders (Maslen 1995).
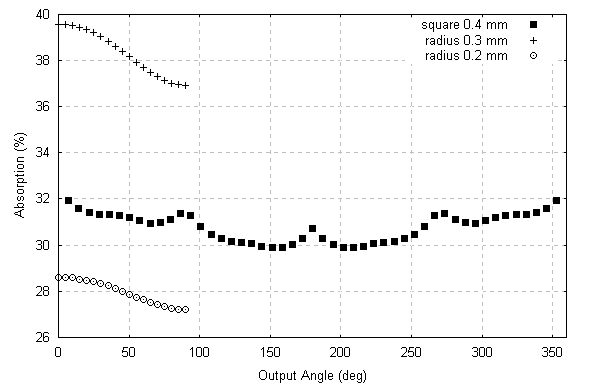
Figure 5 – Comparison between square and cylinders.
Figure 5 shows the comparison between a 0.4 mm x 0.4 mm square and a 0.2 mm radius cylinder and a 0.3 mm radius cylinder, as presented by Maslen (1995). It is very clear that the simulated square sample absorbs more than the smaller cross-section cylinder and less than the bigger cross-section cylinder, which agrees with qualitative expectations.
In order to analyze the behavior of the absorption in crystals, it was chosen to keep the height fixed at 0.3 mm and vary the length from 0.3 mm down to 0.01 mm, which is a typical range of sizes for protein crystals. These results are summarized in Fig. 6.
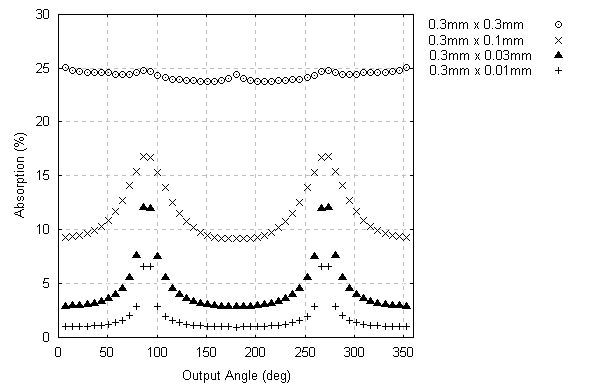
Figure 6 – Absorption for crystals with 0.3 mm height.
The maximum absorption differences seen range from 2% to 10% For smaller crystals, it were performed two simulations with 0.1 mm height. They test for absolute lower limits of absorption.
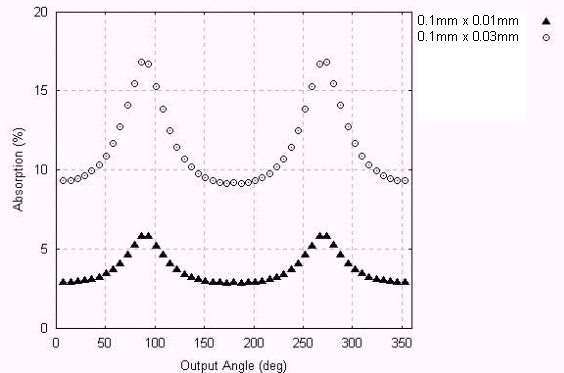
Figure 7 – Absorption for crystals with 0.1 mm height.
It is seen that the smaller crystals absorb much less X-rays - it should be noticed that the absolute minimum absorption achieved is around 3%. But the maximum absorption differences range from 3% to 8%.
5. COMMENTS AND CONCLUSIONS
Regarding crystals in which X-rays traverse different paths, there may arise big absorption differences for different output angles. In the cases studied, the largest difference is near 15%, which is far bigger than the anomalous differences estimated in section 3.2, which is between 1% and 4%. So it remains as an utterly important issue to reduce these disparities. Presently this problem is overcome by collecting redundant data from different output angles, so averaging lessens the absorption difference effects. But absorption introduces a systematic error, which can be eliminated if the geometric constraints of the experiments are known or estimated.
From the results obtained it is clear that care should be taken when choosing the crystal orientation during a data collection, in order to minimize the absorption difference effect. If this is done, the averaging method will be an effective manner to overcome this systematic error. For the cases that require a crystal scan in the maximum absorption difference region, it is strongly suggested that absorption correction is applied to the data, in order to eliminate the systematic error introduced by absorption.
The natural extension of this work is to prepare the simulation for the real 3D crystals, and then to apply the corrections to diffraction data from these crystals.
Acknowledgements
The author is deeply indebted to Dr Igor Polikarpov for fostering the investigations in absorption correction for protein crystallography.
Thanks to the free software initiatives worldwide, which made possible the utilization of Perl and GNUplot for computing and presenting the graphical results of this work.
To Adriana for her support, and for her patience.
REFERENCES
Abramowitz, M., Stegun, I.A., 1972, Handbook of Mathematical Functions, Dover Publications, Inc., New York, 9th printing.
Blundell, T., Johnson, L.N., 1994, Protein Crystallography, 4th printing, Academic Press Inc., London.
Carnaham, B., Luther, H.A., Wilkes, J.O., 1969, Applied Numerical Methods, John Wiley & Sons, New York.
de Meulener, J., Tompa, H., 1965, The Absorption Correction in Crystal Structure Analysis, Acta Cryst., vol. 19, p. 1014.
de Titta, G.T., 1985, Absorb: An Absorption Correction Program for Crystals enclosed in Capillaries with Trapped Mother Liquor, J. Appl. Cryst., vol. 18, p. 75.
Hendrickson, W.A., Ogata, C.M., 1997, Phase Determination from Multiwavelength Anomalous Diffraction, in Carter Jr., C.W., Sweet, R.M. (eds.), Methods in Enzymology, vol.276, part A, p.494, Academic Press.
Maslen, E.N., 1995, X-Ray Absorption, in Wilson, A.J.C. (ed.), International Tables for Crystallography, vol. C, p.520, Kluwer Academic Publishers.