To make things much easier for both the users of the bulletin board and us writing this newsletter, members who ask questions or instigate discussions on the board are now asked (urged!) to post a summary of all the reactions received, whether on or off the board.
The introduction to
Martyn Winn's summary
article in the October 1999 newsletter also goes for this article:
For each subject below, the original question is given in italics, followed by a summary of the responses sent to CCP4BB (together with some additional material). For the sake of clarity and brevity, I have paraphrased the responses, and all inaccuracies are therefore mine. To avoid misrepresenting people's opinions or causing embarrassment, I have not identified anyone involved: those that are interested in the full discussion can view the original messages (see the CCP4BB web pages on how to do this).These summaries are not complete, since many responses go directly to the person asking the question. While we understand the reasons for this, we would encourage people to share their knowledge on CCP4BB, and also would be happy to see summaries produced by the original questioner. While CCP4BB is obviously alive and well, we think there is still some way to go before the level of traffic becomes inconvenient.
Thanks to all the users who are now dutifully posting summaries. Also I would like to thank Eleanor Dodson for helpful discussions.
- Data harvesting for CCP4
- How to deal with refinement parameters
- REFMAC
- Resolution in REFMAC
- Refining occupancies in REFMAC
- High resolution refinement
- Refining occupancies of alternate configurations
- Correlation between B-factor and resolution
- Ramachandran idealisation
- Pseudo-symmetry
- NCS analysis for 222 symmetry
- Pseudo-symmetry R3(2)?
- NCS averaging - translational NCS
- More translational NCS
- Indexing problems
- Indexing
- Scalepack failure
- Strange diffraction pattern
- Reindexing tables
- Patterson for P3121
- Data Sharpening
- Various
- Molecular Replacement with NMR models
- Websites and courses for Synchrotron Users
- Homology model into poor MIR map
- Genetic Algorithms for Molecular Replacement
- Disulphide reduction in protein structures
- Questions on MOSFLM
- Domain movements
- Validation of protein crystal structures at high resolution
- Reducing the size of the Rfree set
- Map displacement
- Calculating rmsd's for loops
- Calculating interaction surface area
- Rejecting reflections after processing
- Various databases
- Structure/Sequence Database
- Compare active sites
- Met as Zn ligand? Metal-site databases
- How to get CCP4 going
(February 2000)
How can I automatically generate a PDB header? I found the program "harvesting" in CCP4, it writes mmCIF files. Is there a way to produce directly a PDB deposition file?
From our EBI correspondent:
The latest version of CCP4 will output mmCIF files for several of the programs (MOSFLM/SCALA/TRUNCATE/MLPHARE/RESTRAIN/REFMAC). At the end of a refinement one can make a xx.tar.gz file of these files and submit these for deposition.
At this stage the atom coordinates are not output in mmCIF format and would have to be submitted as a separate file, within a set of files (see end of this note about deposition to the EBI).
It is not possible to convert an existing CCP4 logfile into harvest format. Harvest files are only generated by using the latest version of CCP4.
The semi-automatic tracking of data through CCP4 will become easier when the next version of MOSFLM is released - this will impose a responsibilty on the user to start labelling data sets and the labels will be included into the first MTZ file. Subsequent use of these MTZ files will transfer labels to both 'harvest results files for each step' and to subsequent MTZ file headers. It is however the user's responsibilty to track each stage of a structure solution and carry out ultimate book-keeping. The harvest files from each stage can then be accumulated into a compressed tar file and submitted for simplified deposition. In addition - it hasn't yet been used in the real world and we don't know how it will mesh with different in-house practical use of different software; as it is common to say start with DENZO, use CCP4 then CNS then O then REFMAC - only experience will allow resolution of any practical difficulties.
The work done at ESRF/BNL and other synchrotron sites to add data labels to image headers will further smooth the flow of information from data collection to refinement by having MOSFLM and HKL2000 read the headers and transfer this to derived files. This is not yet in place.
One can also use CNS and use the mmcif_deposition macro which was in
.../cns_solve_0.9a/inputs/xtal_mmcif/deposit_mmcif.inpthis only does refinement:.../cns_solve_0.9a/modules/xtal/exportmmcifrefine
.../cns_solve_0.9a/modules/xtal/exportmmcifstructthere is also in pdb format (read by autodep):
.../cns_solve_0.9a/inputs/xtal_pdbsubmission/xtal_pdbsubmission.inp
.../cns_solve_0.9a/modules/xtal/pdbsubmissionThe CNS macros (and the equivalent XPLOR PDB macros) deal only with information known for refinement.
Both CCP4 PDBSET and the CNS/XPLOR PDB macros can generate PDB SEQRES records for sequence, although there are problems in some cases with different conformations and the enthusiam that the macros add all, including water, to SEQRES.
There is also info to be written out from HKL2000 (DENZO/SCALEPACK) although this isn't currently the same as CCP4 (MOSFLM/SCALA).
As far as deposition - the EBI is still using PDB(BNL) legacy code in the form of autodep (autodep.ebi.ac.uk) as we in are the final stages of developing a completely new submission system that can handle these files. We have not as yet modified autodep to read mmCIF files - a function this software could never do.
However, until the new system is ready, if you want to use CCP4 or CNS mmCIF output in your deposition, then please do the following:
- Start an autodep submission, upload the files and email pdbhelp@ebi.ac.uk to say you have done this.
- We will convert the files to autodep and allow you to continue the submission.
(February 2000)
Is there a simple possibility to improve the resolution limits in small steps from one refinement cycle to the next using REFMAC (something like the STIR instruction in SHELX)?
Such an approach should not be required in a maximum likelihood refinement package.
In least squares refinement, the high resolution terms are a handicap with a poor starting model becuase they vary much faster with small shifts to the model.
However, in ML refinement, the level of error in itself is a parameter which is determined and refined, and acts to weight down the high resolution terms in proportion to the poorness of the model. No resolution extension scheme is required, because the likelihood already provides a better scheme than any which could be determined by the user.
As far as I know no STIR-like command is available and I don't think it's necessary. Just go on in steps with the command files and that's just fine.
And is there a high resolution limit for the refinement with REFMAC or should one use other programs - like SHELX or CNS - for data better than let's say 1.1Å?
I don't see any reson why there should be a high resolution limit: REFMAC uses the full 5-Gaussian model for scattering factors.
I have refined a couple of atomic resolution structures with REFMAC (as I write this I am refining with 0.98Å data!). The biggest advantage of using REFMAC is that is runs *fast*. I also believe that at that resolution the maps with the maximum likelihood coefficients from REFMAC contain practically no bias to the model. So, it is very useful to do corrections in the initial stages of the refinement, try out double conformations and find quickly all/most of the waters in your structure in conjunction with ARP. Once that is done I usually apply the "finishing touches" (refining occupancies, etc) with SHELXL.
I've refined with REFMAC a 0.97Å structure and it works fine and FAST!!! You can calculate esu from inversion of LSQ matrix with SHELX afterwards.
(February 2000)
Is it possible to refine occupancies for alternate conformations using REFMAC and how does it work? Or is there another CCP4 program which can do this?
Refining occupancies directly, is not possible in REFMAC. The work-around, is to refine the B-values and judge/adapt the occupancies accordingly. There is a debate on whether it is likely that the data can support occupancy refinement unless you have very high resolution:
(September 2000)
I would like to pose one question concerning refinement of
high-resolution structures. This topic has been discussed to some extent
at the beginning of this year, but I would like to go for sure and have
(an) additional question(s):
The situation:
I have refined a quite large structure (6 monomers of 50kDa each in the
asu) at 1.7Å to quite reasonable R-values (Rwork: 16%, Rfree: 19%). Now
I have measured a 1.295Å data set of the same crystal. The unit cell
dimensions differ less than 1%. Because of the huge amount of data
(close to 700.000 independent hkls) refmac5 and ARP/wARP with refmac4
appear to be THE refinement-programs to use (also in terms of tolerable
time for refinement).
The questions:
Is it the reasonable way to start the refinement of the 1.295Å
structure right from the beginning with all the data I have and let
maximum likelihood find its way? Or is it better to use the
"old-fashioned" way to extend the high resolution limit in small
steps and search water in each step?
Is the following refinement strategy reasonable (each step until Rfree
converges)?:
Taking into account resolution and the amount of data: Where should the
R-values converge after proper refinement?
The answers:
Various comments:
I would always start with a bit of rigid body to accommodate the small
changes in cell dimensions.
Can't see any reason to throw away hard earned water positions - the
wrong ones should disappear soon enough.
Biggest challenge and most time is needed to find alternate
conformations, and ARPing can make this harder.
My order is different:
Automatic refinement of complete model against all data (probably with
hydrogens - can't see why not use something which is chemically sensible);
rigid body first, then isotropic.
Sort refined model on B-values, and look at highest 10-15% to see what
has happened.
You usually pin-point some residues which are in loops - maybe all
copies have the same conformation, and can be rebuilt into an averaged
map; others which are obviously in multiple conformations - usually with H2Os
sitting where the 2nd conformer should be.
Once you have made the obvious corrections then maybe start adding more
waters, anisotropic parameters, etc.
Protocols can differ to accommodate NCS.
A few points:
I suggest to use all data straight away. Since your cell parameters
slightly differ and the position of the molecule may be affected,
the quickest would be either:
Run molecular replacement
or
Run PDBSET/COORCONV to convert coordinates to fractionals and then back to
orthogonals with the new cell parameters.
In our experience it is quicker to start with addition of solvent sites
at 1.3Å (refinement of both bulk solvent and overall anisotropy within
REFMAC), followed by introduction of riding hydrogens, then anisotropic
refinement and finishing up with multiple conformations and refinement
or estimation of their occupancies.
Very much depends on the Wilson plot B-factor and overall anisotropy.
A typical value for R-factor would be 11-13 %.
If you are using REFMAC5 you don't need to run COORDCONV. REFMAC5 itself will convert cell dimensions of coordinate file according to MTZ. My experience with higher resolution data refinement agrees with what others are saying. Use all data straight away. Especially in the cases where you have refined data to a little bit lower resolution there should not be a problem.
A few small comments:
I would put in multiple conformations before individual anisotropic Bs, as the
latter can sometimes mask multiple conformations. Otherwise the refinement
protocol looks fine to me. I don't think there is any point in doing steps
of higher and higher resolution. The maximum likelihood combined with some
checking on the graphics should sort things out fine.
The target R and Rfree are difficult to estimate - it depends a lot also on
the quality of the data; it will be important to check the REFMAC output
carefully for geometry statistics and to do validation for example by
Whatcheck. Then you can vary the geometrical restraints so as to minimise
Whatcheck complaints as well as Rfree...
(July 2000)
I'm trying to refine alternate configurations of substrates
in an active site. This was once possible in x-plor, so I'm
using CNS. But the cns-bug-reporter told me that they haven't
yet implimented the option to refine alternate configuration
occupancies in CNS. As you can imagine, since it's my active
site, my chemical argument sort of relies on it. So, I need to
find a program that will do it.
I looked at the documentation for REFMAC, but don't see
anything obvious in the docs or the examples that flags
to refine occ's of alternate configurations.
Can anyone tell me if REFMAC is the way to do this? Or is
there some other program people would recommend that I didn't
look at yet?
Additional info:
The alternate configurations come from a reaction in the active
site of the form: A + B -> C + D, where there is a mixture
of products and unreacted reactants seen.
There are 3 basic answers:
This is true, of course. A method that someone suggested to exercise this caution is...Depending on your resolution, I would opt to only refine B's and adjust the occupancies manually.With this, you can make an initial guess at the relative OCC's based on the density, then refine B's. Presuming the B's for config_1 and config_2 are similar, you can manually adjust OCC's until the B's for the 2 configurations are similar to each other.
I have not tried SHELX, but this seems the best option for high resolution data.
The authors have told me that they have not implimented the option to refine OCC's for alternate configurations. Many people insisted that you _can_ use CNS, but I think I believe the authors on this one.
Someone suggested this manual adjust to the CNS limitation:I used the alternate conformations feature in CNS to refine my substrate with two different puckers. Then used the q-group protocol to define the occupancy for each conformation. Then manually adjust the occupancy to be sure it adds up to one.But, since my substrate is in the formA + B -> C + Dand I know that if A is 80% occupied, then neither C nor D can be greater than 20%... I can say with firm certainty that this manual adjust is not accurate.
(January 2001)
Does any one know if there is any correlation between the overall
B-factor of a structure in relation to its resolution? Are there any
publications on this topic?
Also is there any correlation between the extent of disorder in a
structure and the R-factor/Rfree?
To summarize, many of you believe that there is a (good) correlation between the overall B and the resolution cutoff. But then Gerard's statistics showed otherwise. Some of you attributed this observation to the correlation being masked by effects of experimental limitations.
These discussions are very helpful. However, it would be even more helpful if someone can cite (or tell me the lack of) literature references on this topic.(February 2000)
Quick question regarding a homology model I've built. One could argue this
is redundant since it's only a predicted structure - but...
Is there a program available which can introduce appropriate phi/psi
angles to a given structure so that Ramachandran competent regions are not
violated? In other words, can I get my hands on some software which can
clean up a bad structure and make the Ramachandran plot look nice? I have
quite a few unpleasant residues which would take some time to fix manually.
Here's the quick-and-dirty answer:
A nice set of web-based programs can be found on:WHAT IFThese web-based programs can check, validate and repair your model...
You probably can obtain the program for in house use too...
Then came:
I think the question should not be "how?" but "why on Earth?". Without any experimental data, the best any program can do is to pull residues into the nearest favourable area, but there is no guarantee that this will be the *correct* area (see our 'databases' paper in Acta Cryst D, 1998, for an example of this -even with x-ray data- and a discussion). All this would amount to is (at best) cosmetic nonsense. Moreover, it could give a false impression of the quality of the model.
This was strengthened by:
The answer to your question below is found in a paper by Sali (guru of homology modeling) et al - Proteins, Str. Func. Genetics 23:318-326 (1995) - Evaluation of Comparative Protein Modeling...
where it was shown that: "most ways of relaxing the template coordinates to improve the stereo chemistry of the model increase the rms differences from the correct target structure".
Then the following was added to the original question:
I feel I ought to explain my last e-mail regarding Ramachandran
idealisation. As I mentioned, yes, it's a predicted structure, and so there
is no way of knowing whether the correct angles have been introduced.
However, why build a model at all if it violates standard geometry of
proteins? That's like making a model of a house which doesn't have a front
door or any windows (bad analogy - but you get the point!). Why not
introduce beta phi/psi angles to a region which is predicted to be a
beta-strand?
Just wanted to get that off my chest.
This spawned a final reaction:
Your metaphor is beside the point. Standard geometry includes bond lengths and angles, planar groups, getting your chirality right and not letting two atoms occupy the same part of space - things we "know" and which we don't really need xtallographic or nmr data for to confirm. However, the conformational torsion angles in proteins (phi, psi, chi1, ...) contain the essential information about the structure of the protein - determining their values is what experimental structural biology is all about; predicting their values is what homology modelling is about. Since these torsion angles do not have a unimodal distribution (i.e., more than one "ideal" value) you cannot impose "standard values". Moreover, the Ramachandran plot in particular is often used as a hallmark of structural quality in x-ray/nmr work, so "fudging" its appearance might convey a false message - which I'm sure you wouldn't want to happen.
A better analogy would be the following: you build a model of *my* house! Now, it's a safe bet that my house has a front door and windows. But what you are trying to do is decide what colour my wall paper is, without any experimental observations of said wall paper ... Sure, you modelling my wall paper as "pink with elephants on it" makes your prediction look very precise and detailed - but it is in fact wholly inaccurate! (honest!)
(February 2000)
I am working on the structure of a tetramer with non-crystallographic 222
symmetry. It is not difficult to determine the three two-fold axes
separately by superimposing dimers, but
I would need this information e.g. to compare two of my structures by
superimposing their 222 axes.
So, basically, my question is, does anybody know about a program which
extracts the best 222 axes set from my coordinates?
Obviously, there is no easy answer to this problem. Nobody could point me to a program that reads in a pdb-file containing four monomers with non-crystallographic 222 symmetry and writes out three mutually perpendicular 2-folds which best describe the approximate symmetry of the tetramer in the pdb-file.
BUT, there are some 'approximations' which work as well, at least for the time being and the goal in mind.
(May 2000)
I wonder if I could get some help on a problem that is driving us mad here. We have a 1.65Å resolution data set collected from a rhombohedral crystal (there was also a low resolution pass at 2.8Å). All data were processed and merged with DENZO/SCALEPACK. If we don't try too hard in the autoindexing we get the following cell:
rhombohedral setting:   56.646   56.646   56.646   92.678   92.678   92.678
hexagonal setting:      81.960   81.960   93.417   90.000   90.000  120.000
The data set then processes nicely as R32 with a completeness of 100% and an overall Rmerge of 4.4% (11.0% for outer shell). If we do it as R3 it gives virtually identical statistics. In R32 we get one molecule per AU with AMoRe. This refines reasonably well (Rfree around 24%) but a few bond distances persistently misbehave. If we do it as R3 with 2 molecules per AU, we can get the Rfree down to around 22%. However the operation relating one molecule to the other appears to be a near perfect crystallographic one. When the 2 independently refined molecules are superposed the differences are minimal and I would say not significant. I think the improvement in Rfree is simply due to allowing the refinement more freedom.
At this point we went back to the raw data and took a closer look. It turns out that there are alternate layers of strong and very weak reflections. If we drop the peak picking threshold in DENZO until it finds a significant number of these weaker reflections we then get the following cell:
rhombohedral setting:   78.313   78.313   78.313   63.129   63.129   63.129
hexagonal setting:      81.987   81.987  187.165   90.000   90.000  120.000
i.e. the c axis is twice as long in the hex setting. This also processes nicely as R32 with a completeness of 100% and an overall Rmerge of 5.0% (17.3% for outer shell). When we tried to run AMoRe on this it gave some very strange results - some problem with defining the Cheshire cell for non primitive space groups (although it does say in the manual that you can get problems with rhombohedral cells). We assumed the weak reflections mean that we have a repeating unit consisting of two of the "small" cells with the molecules in virtually the same orientation. So we generated a second copy of the molecule from our small R32 cell by applying half a unit cell translation along c. This model was then put into rigid body refinement in REFMAC, but Rfree was very high around 60% even though the packing looked fine.
If we look at the outputs from TRUNCATE (truncate_small_r32.log and truncate_big_r32.log) they are a bit strange, in particular for the big cell. Look at cumulative intensity distributions and moment2 values for acentrics. There is also a bit of a bump in the Wilson plot at about 2Å resolution.
As an added complication there is a very strong non-crystallographic 2-fold axis relating one half of the molecule to the other, so that it looks virtually identical if you invert it. This means you have to be very careful which way up your MR solution is.
We have tried submitting the data to the "Crystal twinning server" but the twin fraction is less than 2%.
So does anyone have any suggestions as to how we proceed? Obviously the easy way out is to ignore the weak data and go with the small cell - after all an Rfree of below 25% is definitely publishable!!
On the basis of several comments we tried a few things and I posted a follow-up message:
We are still struggling with this one, which is why we haven't posted a summary yet. We are now working in the big R3 cell with 4 molecules in the AU. AMoRe didn't work with a single molecule as the search model, but we were successful when we used the dimer from the small R3 cell - confused?
Anyway, the maps look quite nice, but the refinement is a bit disappointing: Rfac=25%, Rfree=28% (they were 19 and 22 in the small R3 cell). Also the overall FOM in REFMAC is 0.51 (it was 0.84). Could this be because the alternate layers of strong and weak reflections make it difficult to scale Fobs to Fcalc in REFMAC? The data have been processed with DENZO/SCALEPACK, maybe the situation could be improved using MOSFLM/SCALA. Unfortunately we can't get MOSFLM to correctly autoindex in the large cell as the spot picking routine struggles to find the weaker spots - it just gives us the small cell. Is there a way to convert a DENZO autoindexing solution into MOSFLM format so that we can proceed with this approach??
Here is a summary of the comments received:
There were several responses suggesting that our problem had many similarities with a case described in Carredano et al., Acta Cryst D56, 313-321 (2000).
Our problem is indeed very similar, but we don't see alternate layers of molecules with high and low B-factors. Also in this paper there weren't alternate layers of strong and weak reflections. They stated that the pseudo-equivalent reflections have the same amplitude within experimental error, thus Rmerge does not discriminate between R3 and R32 which agrees with our observations.
A similar problem was reported in P21 which was so close to P212121 that it could actually be solved in the latter.
The following (good) point was made by some: the MR didn't work well in the long cell because the stronger reflections will dominate the result whilst the weak ones will contribute very little.
Another point: there is a form of disorder giving well-defined spots at non-integral lattice positions which is discussed in Giacovazo's book. This does not, however, seem to apply to this R3(2) case.
Similar experiences in a number of systems including R3 are reported, and suggested that we may have a superlattice. This is under investigation.
The cumulative intensity distributions look fine. With every other layer weak you have many more weak reflections than you would theoretically expect for a structure with random atoms (which is where the theoretical plots originate from). Or in other words, having two molecules in almost the same orientation is indeed far from random!
A similar problem is reported where there were two slightly mis-oriented molecules in the big cell (perfectly oriented in the small cell). They eventually published in the small cell however. The conversion from small to large cell (presumably in R3) however is not simply adding another pair of molecules related to the first by a half cell translation along z. It was suggested taking the latter (m1 + m1 shifted in 0.5 z) and rotating it by 60 degrees, which should give nearly identical Rfactors back in the big cell. In fact, the molecule does not rotate, it is just the axis system rotated when moving to the big cell.
On a similar note: you need to reindex somehow - for R3(2) the requirement is that -h+k+l = 3n. When you double l and change all l1 to 2l2 this no longer holds unless you change the direction of the l axis.. i.e. you need to reindex as -k,-h,-2l. If -h1 + k1 +l1 = 3n, then -h1 + k1 +l1 -3l1 (=-h1+k1 -2l1) = 3n'. So reindexing as -k,-h,-2l gives +k -h -2l which is OK.
I'm having trouble getting my head round this but if you rotate the (correct) solution in big the cell onto that in the small cell using LSQKAB we get the following:CROWTHER ALPHA BETA GAMMA 56.59279 179.79269 176.43974 SPHERICAL POLARS OMEGA PHI CHI 89.89634 30.07633 179.90738 DIRECTION COSINES OF ROTATION AXIS 0.86536 0.50115 0.00181So there is not just a simple translation relating one cell to the other. I should also point out that the missetting angles from autoindexing in DENZO are also different.
There do seem to be many cases of such pseudo-symmetry with Fabs. The present case is not an Fab however, but a binding protein.
A program called DENZO2MOSFLM, written by Phil Evans, was recommended, which will do the transformation, but it should be noted that the overall Rfactor and Rfree will ALWAYS be much worse in the real cell SIMPLY because half of the data is systematically very weak. If you were to calculate R and Rfree for the l=even data (try it !!), you should find that they are very much better, if you do it for the l=odd data, you will find they are dreadful.
It was suggested converting .x files from Denzo into a format to be read into SCALA.
It was suggested that to get MOSFLM to deal with your larger cell, just let autoindexing do what it wants, then change the c-cell dimension in the menu top left. Predict after that and confirm that it is looking for the weak spots. (However, some of the observations mentioned above suggest that this wouldn't work for R3 although I haven't tried it). Also, if the two pairs of molecules are perfectly aligned in the model, the structure factor calculations will give exact zeros for the intermediate layers. You will have to use the rigid body refinement in REFMAC to break out of this. Incidentally, when you TRUNCATE the data in the large cell, check the N(z) plot, and make sure that the observed curves are to the left of the theoretical ones. This is an indication of the data being weaker than the cell symmetry suggests, but that is exactly what you have: an accidental alignment in the cell which renders the intermediate layers weak.
Felix Vajdos had a similar situation (see Vajdos et al. Protein Science, 6: 2297-2307 (1997)) that he never quite satisfactorily refined. They had a small (P43) cell which turned out to be a sublattice of a larger P41 cell (P43 is a subgroup of P41 and vice versa provided the c-axis is increased by a factor of 3). We raised some important observations:
Another comment on the reindexing:
Of course Rfactors are always higher for weak reflections; if
you run old RSTATS you can get the Rfactors as a function of |F| as
well as resolution.
Or split the file into two - hk 2l, and hk 2l+1 using MTZUTILS:
RZONE 0 0 1 2 0 gives l=2n and RZONE 0 0 1 2 1 gives l+2n+1 and run
RSTATS on the two subsets..
I suspect you have really good Rfactors for the stronger data and it is
OK in fact (you were presumably careful to make sure the pseudo-R32 equivalents
are both either Free or non_free..).
Yes we adopted a similar procedure to that used in Carredano et al., Acta Cryst D56, 313-321 (2000). Basically apply Rfree to data set processed in R32 and then expand to R3 using SFTOOLS. Then we CADed these Rfree flags onto our data set processed in R3. Whereas in the paper they just used the expanded R32 dataset.
Another similar problem: P21 crystal, with a 2 fold NCS axis almost parallel to b. The maps looked very good (these were also high resolution data), but the Rfactor got stuck just below 30% (Rfree around 32%). Later on a native data set was collected, which happened to crystallize in the smaller cell (no NCS) and the previous model refined easily to about 15% without doing anything to the protein chain. I always had the strong feeling that it was the weak "in between" reflections which were to blame for the high Rfactor in the case of the former data set.
It was pointed out that what we describe is not pseudo-symmetry but a superlattice. Refining such a thing is known to be a pain in the ass even in small molecule crystallography (I agree!!!!). The fact that your R and Rfree go up when refining in the larger cell is absolutely normal since you are adding a whole load of relatively weak (but perfectly valid) reflections. Remember that R-factors are unweighted statistics. Therefore the correct description for your structure is when using the larger cell which results in higher R and Rfree. It is definitely not a scaling problem. A superlattice means that the internal symmetry in the smaller cell is broken, but that it still holds approximately. There are, however, some small differences introduced and all information relating to these differences is present in the layers with weak spots (so, DON'T use sigma cut-offs to get lower R-factors! It will just hide the correct structure). Using only the small cell will provide you with an average structure. In fact you should not try to compare R/Rfree between the large and small cells since they are not calculated using the same sets of data. The fact that your density in the large unit cell is really clear means that what you are doing is probably correct despite the higher Rfree.
As a result of several suggestions we split the R3 big cell data set into the strong and weak components using MTZUTILS and carried out the following analysis:
           Relative         <I>/<sigI>
              <I>         out. shell(1.65A)         Rcryst (Rfree)(%)
All l         50               6.2                    25.5 (28.1)
l = 2n        100              9.3                    21.0 (24.0)
l = 2n+1      1                0.5                    50.8 (52.1)
So the weak reflections are REALLY weak!
It's good to see that we are not the only ones with this kind of problem and that there is no clear-cut solution - other than to crystallize in another space group! I think we will use the small R3 cell after all.
(October 2000)
What is the easiest (or best) way to get a NCS-matrix out of a phased
map? I got below average MAD-phased map, and I know
2 Se positions. There are 2 monomers per ASU. I tried FINDNCS (I also
have 4 very very weak Pt site positons), and the result seems not
very convincing. From the non-averaged DM map, I can see the solvent
boundary, and I can barely see the two molecules. I need to
get the correct NCS-mask, or correct NCS-matrix. When I put the NCS-matrix
I got from FINDNCS in DM, it didn't give me anything better
than I got as a non-averaged map.
I have also played with MAPROT, MAPMASK, NCSMASK, tried to get a NCS-mask
but without success.
Addendum:
Before this MAD (2.2Å) data set, we had a 2.4Å native dataset and I have
tried MOLREP with a poor MR search model. The self-rotation function did not
show a proper two-fold. After many trials in AMORE and MOLREP, all the solutions
suggest that two molecules have the same rotation but with a translation shift by half
in Z (and less than 1/10 in y). This is in P21. But the MR-solutions are not refinable,
so when I collected the MAD data, I tried GETAX after phasing by SHARP, and it
didn't work due to lack of proper 2-fold.
So that is why I want to find a better way to do NCS-averaging.
I will try to use the MR-solution to get a NCS-mask and doube-check if the MR-solution
is at least in the right place compared with the MAD map.
This is a brief summary:
As it turns out, it is a translation NCS which is not as useful as
rotational NCS. We also obtained two crystals from Hg soaking which produces a unit
cell half the size of the original. Now I am trying to refine the MR solution
using this new dataset. Maybe I should get the Maximum Likelihood MR
program from Randy Read for this rather poor MR model.
Several people suggested using GETAX.
Try automatic NCS in DM or use any protein with similar size to get a mask, and use O to find the matrix graphically.
Use bones from the map to get the mask.
Here is a nice script using AMORE to find out the NCS-matrix.
Use FFFEAR.
Use SHARP and SOLOMON or SQUASH to get the best non-averaged map and look for the secondary structure element in the map, and then figure out the NCS-matrix.
Use EPMR to get the MR-solution.
Look at the self-rotaion function and use the solvent flattened map as input to POLARRFN.
PS: one last question, just a little doubt: will that translation NCS prevent me finding the Se sites? I don't think so, but we should have 9 sites per protein instead of one. No matter how hard I tried, I can only find one Se per protein (so two sites per ASU), the two Se sites are related by (0, 0.04,0.5).
Addendum to summary posting:
This is bad news; translational symmetry might make it harder - more
complicated Pattersons etc., but if you have only found one Se there is
something seriously wrong - possibly no Se in the crystal; possibly not
enough signal.
How did you position the Se? If the MR-solution is correct, phases
based on the solution should be able to show you the Se sites; I usually
do a Dano Fourier, but a dispersive difference Fourier should show you
the same sites.
(October 2000)
I have a pseudo translational NCS which relates the 4 mols in the asymmetric unit by ~(0.5, 0, 0) and ~(0.25, 0.25, 0). The 4 mols differ slightly on the domain angle as a result of lattice packing. The resolution is 2.4Å, and the space group is C2. MAD maps etc. were not that great, but I managed to build the model manually, and have refined a couple of cycles so far. The 2fo-fc and fo-fc maps have showed many new and nice features, which is encouraging, but R/Rf is about 41/45.
Before going further with the traditional procedure,
I think I should understand a few things:
Here is the most comprehensive answer to the computational/theoretical questions:
Indeed, thin shell selection is only relevant for rotational NCS. The alternate layers of reflections are not correlated at all (at least not more so than normal neighbouring reflections). Their main difference is that for the even reflections the diffraction of the molecules related by the (0.5, 0, 0) translation add up nearly in phase and for the odd ones they nearly cancel out.
Since the NCS 2-fold is nearly parallel to the crystallographic 2-fold, the "NCS" correlations introduced in reciprocal space are between reflections related by 2-fold crystallography or nearly so. Since we only refine against the "unique data", these 2-fold related reflections will not be in the unique asymmetric unit and will therefore not be in your working set of reflections. So selecting your test set is unfortunately not your biggest problem. Just use a random selection.
NCS correlations lead to a slight model bias in the test set. The extent of the effect depends on the level of NCS. E.g. I wouldn't worry about 2 or perhaps even 3-fold NCS, above that it may become significant. The general feeling is that even with NCS correlations, the R-free will still indicate if your refinement is heading in the right direction. However, Sigmaa estimation is also based on your Rfree set. The NCS-induced bias will suggest that the model is better than it really is leading to improper weighting. So in theory, yes, you may have to worry about high NCS. The problem is that selecting reflections in thin shells isn't a great solution either. To get a reasonable number of shells they have to be very thin. As a result a reflection in a thin shell often does not have its NCS-related reflections in the same shell, defeating the purpose. Selecting small NCS-related volumes for Rfree may be better and I have started implementing that in SFTOOLS but never got to properly testing it, so it is not in the CCP4 version of the program. In short, I don't think there is an ideal answer. The positive side is, the higher the NCS, the less the risk of overfitting (but remember that in your case of translational NCS this whole issue is not relevant).
With regards to the effect of weak reflections on the map: well it is not going to help you. However, the contribution of a reflection to the map is proportional to the reflection amplitude. So the quality of the map will be dominated by the 50% of strong reflections.
Then came a number of suggestions on working around the problem by going back to the lab bench, for which the summary is:
Others suggested to tweak crystals into a smaller cell by:
- using cryoprotectant:
"... regularize into crystallographic symmetry when cryoprotectant was soaked into the mother liquor and the crystals were frozen",and"adding 5% glycerol (I was using 20% as cryoprotectant) to my crystallization trials not only gave a four times smaller cell with all translation-only NCS removed - it also increased resolution from about 2.5 to 1.5Å.
The same reduction in unit cell occured when going from 0 to 20% cryoprotectant using the original crystallization conditions. But the crystals did show some cracks and were not as good."- using heavy atoms:
"We had a situation where heavy atom soaking changed to smaller cell with no loss in the diffraction quality and resolution.
Similar was the experience with cocrystallizatin with heavy metal compounds in at least one case I read. In that case, there was even a great increase in the resolution ( Ref: Ronning et al. (2000) Nat. Struct. Biol. Vol. 7, 141-146.
Another useful reference regarding pseudo-translation problem is Chook et al. (1998). Acta Cryst. D54, 822-827."- or reducing humidity
As a super bonus, the new crystal form often diffracted to much higher resolution. It was suggested to use correlation coefficent rather than R-factor and to study into the contributions of the weak reflections on phasing.
(April 2000)
We have collected some data on station F1 at CHESS. The crystals appeared to be hexagonal thin plates and diffracted to about 2.2A. We collected 75 degrees of data for each of the three crystals. The spot shapes looked OK but we could not index the spots using DPS, DENZO or MOSFILM. The spots seemed to align along straight lines on all images and one could see the hexagonal features. Has anyone come across this before? Your help is greatly appreciated.
The suggestions/conclusions are as follows:
(May 2000)
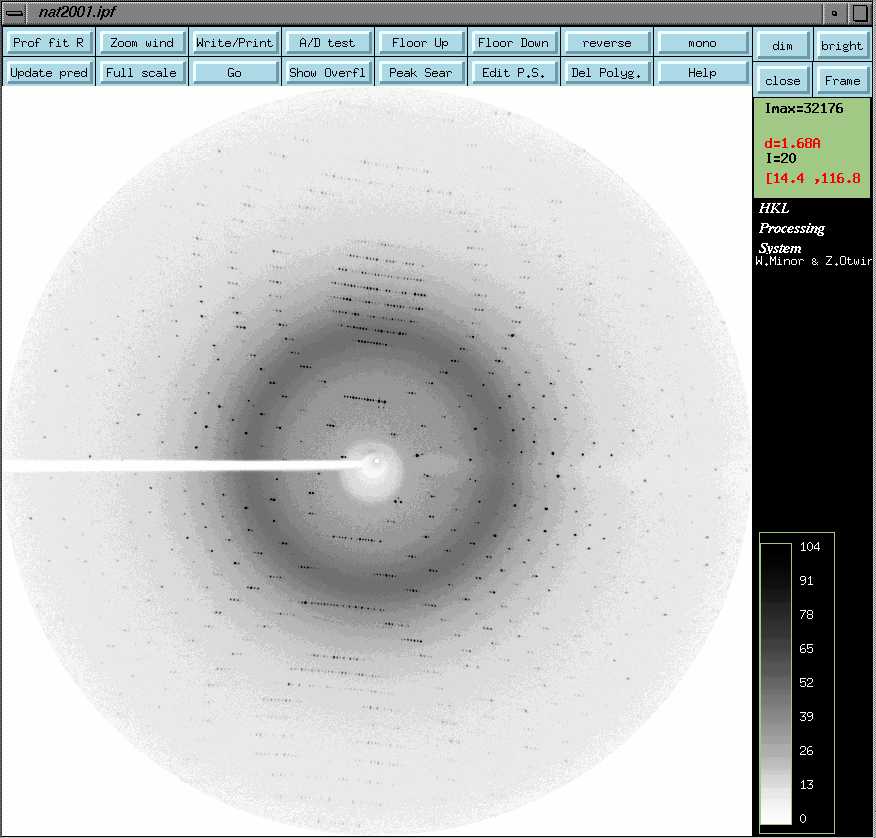
I got hexagonal crystals of a protein. My previous data show the space group
is P6122. Recently I put one of my best crystals for data collection. The
frame looks good (see picture; click to get better resolution).
 And I use DENZO program to index the data. All previous steps go on smoothly, until I scale the data.
The scale result is very bad (see part of scalepack output).
The linear R factor is about 0.516
and square R factor is 0.922 and the chi**2 is obviously wrong. But I
notice that the chi**2 of each frame during process is near 1 which is OK.
Could anyone help me to figure out the possible cause?
And I use DENZO program to index the data. All previous steps go on smoothly, until I scale the data.
The scale result is very bad (see part of scalepack output).
The linear R factor is about 0.516
and square R factor is 0.922 and the chi**2 is obviously wrong. But I
notice that the chi**2 of each frame during process is near 1 which is OK.
Could anyone help me to figure out the possible cause?
Suggestions:
I tried these suggestions recently. It should be wrong index! But I checked each parameter of index carefully, no one is wrong. I tried the lower symmetry P6 as well as other symmetry suggested. No improvement. In fact, I never doubtle the symmetry of P6122 myself. I tried some smaller crystals as well as heavy atom derivatives before. This symmetry gives successful result. If it is wrong symmetry, all my previous data would have the same problem. The problem seems to be solved after the beam is alined and the detector is pulled back to 200mm. As some of you noticed, c is high, about 196Å, from my previous index result. The error will be disastrous with even a little beam line deviation. Another cause might be short distance (150 mm) diffraction with a very big cystal which give too much crowded and strong spots, although I can not see overlap of spots.
(June 2000)
We have now observed for the second time within a few months a strange diffraction behaviour of two totally unrelated proteins which crystallize in space group R32. Whereas for the first protein (sex hormone-binding globulin) we did get nice diffracting R32 crystals with one steroid bound, we now keep getting these misordered crystals with a different steroid. For the second protein, we only get these misordered crystals.
The major characteristics of these images are, that planes with nicely shaped spots do alter with planes which have smeared reflections. Basically planes with l=3n (hexagonal setting) do alter with planes (l=3n+1, l=3n+2) with smeared reflections.
I thought about reticular merohedral twinning, but then I would expect twice the number of reflections on the planes (l=3n+1, l=3n+2) but still nice spots. Maybe not ??
One other characteristics is that the smeared spots on these planes do not fall on the R32 lattice but are slightly displaced. If you draw a line on the 1° oscillation images between the nice spots, the smeared spots do not fit onto the line (see image 3). I therefore tried to index with a P3 lattice instead of the R3 lattice. In that case the reflections are fitted better but of course there is an enormously high number of predicted spot positions with no spots to be seen.
What intrigues us is that we observed this now for two different projects. Probably we will just have to look for better crystallisation conditions, however it would help us if we could understand the problem.
Several replies pointed me to the following papers which deal with statistical layer disorder.
It took me a while to organise these papers and indeed it seems that such statistical shifts (in both directions of layers) might be at the origin of the smearing of distinct reflection layers while other reflection layers remain sharp. Still intriguing to me is the fact that the spots in our case don't fit exactly onto the lattice anymore. The same has however also been observed in case of neuramidase (Luo et al). Further suggestions dealt with crystal handling. We actually also mounted crystals in capillaries, however still the same smearing. There seems to be some light on the horizon now by increasing the salt concentration during the crystallisation ...
(March 2001)
I'm currently looking for a table that lists all possible indexing relationships between two different data sets of the same crystal form if the true space group symmetry is lower than the lattice symmetry (i.e. true space group P3, lattice point group 3barm). I don't need this only for my special case (where I think I've got all possibilities), but I believe this should be of general interest to all crystallographers who have to get consistent data sets from the same crystal form (i.e. all searches by trying different soaking conditions). Of course, the first thing I did was to look into the International Tables A,B,C, but surprisingly, I didn't find such a table (or I have eggs on my eyes). Do you know about such a table and could tell me and the CCP4BB the reference?
Thanks a lot! I've received several pointers to tables with possible reindexing relationships. Many of them were lying directly in front of me! Thanks to all of you!
Here are the pointers:
(August 2000)
I am working on MAD data set at 2.0Å resolution. When I run Patterson function using fft, I do get peaks for heavy atom. Since my space group is P3121, I have confusion how to interpret the map. So how to get the coordinates for these atoms to use in MLPHARE? Is there any software available to interpret (except RSPS) this Patterson and give coordinates of heavy atom, so that I can use it for difference Fourier or in MLPHARE? Can anyone give some suggestion how to work on this space group.
It was a hand problem so I have to change the space group to P3221. I am giving the summary of the responses which could be helpful to others.
As far as the space group goes, there are no special tricks, all Pattersons obey the same rules; peaks at vectors between atoms. The Harkers follow from the symmetry positions:
| (-Y,X-Y,Z+1/3) - (X,Y,Z) | -> | (-Y-X,X-2Y,1/3) |
| (Y-X,-X,Z+2/3) - (X,Y,Z) | -> | (Y-2X,-X-Y,2/3) | (Y,X,-Z) - (X,Y,Z) | -> | (Y-X,X-Y,-2Z) |
| and because of the centre of symmetry there will also be a vector at (2X-Y,X+Y,1/3) | ||
So you can look at the Harker section at z/w=1/3 and see if you can find peaks which satisfy the required algebra, and scan for peaks u,-u,w and then solve for Y-X.
If the algebra gets too heavy (and I think it does in P3121!) you can use SHELX Patterson search (it is set up as part of CCP4i) but ALWAYS first look at the peak list and Harker sections of your Patterson; if there are no clear peaks then you won't be able to find a solution.
But remember that you can get a set of solutions (x,y,z) in P3121 or the related set (-x,-y,-sz) in P3221 so when you test the other hand you need to also change the symmetry. This is all set up very nicely in CCP4i.
I guess the easiest thing is to throw everything into SOLVE, and most likely the program will come up with the right solution. Unfortunately, this will take away all the fun with solving the Patterson by hand. Whatever you choose to do, the correct choice of spacegroup is critical, and I'm not sure what SOLVE does to handle this problem. If you find your sites by hand, and then refine them with MLPHARE, you will need to pay attention to the signs of the anomalous accupancies. There are four possible solutions, corresponding to a left- and a right-handed configuration in each of the two spacegroups. You will need to select for strong and positive anomalous occupancies (there should also be strong and negative, weak positive, and weak negative solutions in the two spacegroups). Throughout, you can initially choose one of the two spacegroups, because even if you picked the wrong one, you will at least get the high anomalous occupancy right (whether negative or positive), if your heavy atom positions are correct.
You have at least three choices for automatically finding your heavy-atom sites:
Phasing by Multiple Anomalous Diffraction (MAD)
Heavy atom search
If the Patterson has such clear peaks, just run it through SHELX - it will probably do it for you in a minute (literally). Or else SnB, which is very powerful and also very easy to use, although it doesn't use the Patterson as such.
Web pages are (in case they're not installed already):
SHELX
SnB
Or you could try the CCP4 program VECSUM, but it's unsupported, apparently. Haven't used it myself, so wouldn't know how effective it is. RANTAN in CCP4 could also do the job.
As with any Patterson map you can start with the symmetry opperators. These should be pair-wise substracted from each other. Yielding 6 times 6 combinations of (u,v,w)'s (which are combinations of x,y,z). It will become obvious that there are certain Harker sections. The two obvious ones in this space group are z=1/3 and z=2/3. But all others will also be pretty nicely arranged on planes (I don't remember it correctly but these are something like u,v,w = x,2x,any z; anyway these are of less importance). Now you check the positions of the peaks in the Harker plane z=1/3. These have a certain (u,v,1/3); now go back to the equations you have calculated by subtracting all the symmetry operators which gave the Harker section and start calculating. Remember that the (u,v,1/3) can also be (-u,-v,1/3) or (1-u,1-v,1/3). So it gives you a lot of equations that will give you certain x,y for the heavy atom site. Now try and see if these sites give all the other peaks. If so you have got yourself a solution. For more than one heavy atom this becomes pretty complicated, but if you have one heavy atom bound it is do-able and very illustrative.
Also several people suggested the program SOLVE. It worked nicely with one single solution, which I refined using MLPHARE for both hands.
(April 2000)
I am interested in "sharpening" my reflection data by applying an
artificial temperature factor (e.g. -70 Å**2). This seems non-trivial,
as I am not sure what do with the sigmas. Before you all think I'm
nuts, others have done this in low resolution structures with favorable
results, such as:
Borhani, et al. (Apolipoprotein A-I) PNAS 94:12291-12296.
Stehle, et al. (Simian virus 40) Structure 4:165-182.
Unfortunately, these papers were not so informative as to HOW they
actually did this.
Does anyone have an idea of a program to use that will do this sort of
modification?
David Borhani wrote with advice based on his experience with Apolipoprotein AI. They wrote a modified version of TRUNCATE that would apply the artificial B-factor to the data, but this was never incorporated into the general release of CCP4. He had good suggestions on low resolution refinement as well.
Rod Mackinnon (potassium channel structure) used Xplor to calculate an anisotropic B-factor array, applied this to the F's and converted his Sigmas manually by using Sigmanew=(Fnew/Fold)sigmaold. This is equivalent to directly applying the scalar calculated from exp(-Bsin**2theta/lambda**2) to the F's and Sigmas.
It was suggested to use Ecalc, but I didn't want to normalize the F's at the same time.
Another suggestion was to use the BIOMOL suite of programs, which we don't have installed here.
I subsequently figured out that you can use SFTOOLS to apply functions (real or complex) to various columns of data, but didn't get around to using it yet because:
Eleanor Dodson saves the day with a modified version of CAD that will apply an overall B and Scale factor to the data. This version is now available publicly: see the SCALE keyword in the documentation for CAD if interested.
(January 2000)
I am doing some general studies concerning using NMR models in MR. If you happen to know of any such cases, published and unpublished, can you give me some references?
1999:JMB 292:763 Cell 97:791 Acta Cryst. D55:25 JMB 288:403 JMB 286:1533 NSB 6:721998:
Nature 395:244
Biochemistry 37:15277
Biochem. J. 333:183
Structure 6:911
Structure 6:147
Acta Cryst. D54:86
1997:
NSB 4:641996:
FEBS Lett. 399:166
Acta Cryst. D52:469
Acta Cryst. D52:973
1995:
PNAS 92:10172
EMBO J. 14:4676
JMB 247:360
1994:
Structure 2:1241
NSB 1:311
1993 and before:
Cell 68:1145
PNAS 88:502
JMB 206:669
Science 235:1049
and finally, an unsuccessful attempt: Structure 5:1219
(January 2000)
A central resource for macromolecular crystallographers seeking information on synchrotron beamlines in the USA is available at:
http://biosync.sdsc.edu
This website, which has been developed on behalf of BioSync, the Structural Biology Synchrotron Users Organization, combines and organises information about beamlines at five different synchrotrons in the United States. It provides technical information about beamlines in a standardised format which is easy to compare. The site also functions as a portal for investigators planning visits to synchrotron facilities. Researchers can obtain schedules, contact, logistical and training information, and applications. The information is contributed and maintained by representatives from each of the synchrotrons.
(February 2000)
RapiData 2000 - Learn about crystal cryogenics, MAD data-collection techniques, and use of modern phasing software from the experts.
(January 2000)
I have a poor MIR map and a homology model. The molecular replacement failed to give a clear translation solution. Does anyone know some real space search programs which may help fitting the model into the Fouirier density for map interpretation?
Kevin Cowtan's 'fffear' (Cowtan K. D., Acta Cryst. D54, 750-756) runs much faster than ESSENS (Kleywegt G. J., Jones T. A., Acta Cryst. D53, 179-185), by which it was inspired. It is much easier to use, and fits with the rest of CCP4.
(February 2000)
Here is the summary for my question about Genetic/Evolutionary Algorithms applied to Molecular Replacement:
(February 2000)
Can buried (i.e. small or no solvent accessible surface area) disulphide bonds be reduced to cysteines in general? I have a structure in which 2 cysteines are in the right position to form a S-S bond but the electron density shows otherwise. My protein was purified in reducing conditions. However, from other evidences (structure homology), these should form S-S. Does anyone know of any published structure that can shed light on my puzzle?
Reduced disulphide bonds can be an artefact of data collection. This happens due to radiation damage at high energy synchrotron sources, even at 100K, and was described in Weik et al., (2000) PNAS 97, 623-628.
Did you measure the distance between the sulphurs? It should be around 2.05Å for a disulphide bond and more than 3Å for a nonbonded contact. If it truly is reduced, look at the CB-SG-SG-CB torsion angle, this likes to be near +/- 90 degrees. If disulphide bond formation would have to indroduce large distortions, then that may stabilise a reduced state. Are both cysteines conserved among related sequences, do they sometimes have only one cysteine or do they always have either two or none? The first and last cases would suggest a special interaction, whereas the middle one suggests that the cysteine is "just a hydrophobic buried residue". No guarantees either way though.
(April 2000)
A plea from Harry:
Can I just repeat something that I've posted before on this BB? If you have problems with MOSFLM (especially with crashes and hangups), the people to contact in the first instance are Andrew and/or me; except when we're both out of town, we have the fixes to hand!
Oh - BTW, _before_ asking anyone, it's worthwhile having a look at URL www.mrc-lmb.cam.ac.uk/harry/mosflm, which has fixes for numerous problems and hints for installation. It's not comprehensive, but I do have answers to most questions there.
(May 2000)
I would have liked to characterise a domain movement in 2 closely
related proteins with DYNDOM.
Following the scripts provided and fiddling with the parameters I always
end up with the following message:
WARNING NUMBER OF RESIDUES IN CHAINS IS DIFFERENT 303 300

determining backbone atoms of first conformer

determining backbone atoms of second conformer

number of residues used for analysis:  300

rmsd of whole protein best fit:    6.969 A

number of clusters:   1

number of clusters:   2
found cluster for which all domains are less than minimum domain size
so we stop

NO DYNAMIC DOMAINS FOUND
TRY ALTERING PARAMETER VALUES
It was indicated that the proteins should have:
Editing the pdb-files in this respect gave results only for very small domain sizes ("domain" keyword). Those however did not reflect the actual domain movement but rather some flexible residues at the N-terminus. Cutting the N-terminus from the pdb-files gave more sensible results.
Guoguang Lu advertized his DOMOV server bioinfo1.mbfys.lu.se/cgi-bin/Domov/domov.cgi, which was very convenient to use.
(June 2000)
I have refined a high resolution crystal structure using various program packages (CNS, REFMAC, SHELX). For the comparison and validation of the models I would like to get some statistics such as rmsd of chiral volume, bond length, bond angles, torsion angles, contacts between non bonded atoms etc. (the REFMAC output includes this information). I am not searching for a program which produces plots (PROCHECK) or individual rmsd. I would like to have overall values. Is there a program able to do this and is such an analysis reasonable to compare the models?
A warning first: this analysis only makes sense if the used restraints for all programs would be comparable. Example: XPLOR/CNS defines chiral volumes as improper dihydrals.
Annotation: CNS has no implementation to perform anisotropic temperature factor refinement. Jiffies have been written by R. Steiner to calculate characteristic parameters from SHELXL outputs.
The easiest way to compare results is take all the models and run each of them through REFMAC for 1 cycle only - the initial statistics will give you a direct comparison. Whether or not any of these statistics tell you that one model is better or worse than another is of course another matter!
Some useful web sites are
(July 2000)
I refined a structure against data to 2.3Å, where the Rfree set included 2600 reflections (5% of data). I now have data to a much higher resolution, and putting 5% of data in the Rfree means 11000 reflections, which is quite a lot. I would like to use a smaller fraction for the Rfree set (say 1%). For this, I need only to keep 1 every 5 reflections of the "low resolution" free set. Any hints on how I can do this?
It was suggested to get a new Rfree set with the desired size, and to remove bias with annealing or throuh model coordinates randomisation (PDBSET). Also, to use ARP_WARP, either to remove bias in the new Rfree set, or to build the structure from scratch.
As a direct answer to the question, this is a way to reduce Rfree set size, using
SFTOOLS:
If you do want to keep 1 in 5 of your old test data, you can do
it fairly easily in SFTOOLS. I'll assume the working data have a 1 in
column RFREE and the test data have a 0. I'll also assume you have a
column called F_Old which contains the original amplitudes. Then do the
following in SFTOOLS:
read my.mtz
select col rfree = 0          ! only old test data
calc col rfree = rfree(0.2)   ! keeps 1 in 5 of old test data
select all
select col F_old absent       ! only new data
calc col rfree = rfree(0.01)  ! flag 1% of new data
select all
write my_new.mtz
(July 2000)
I'm attempting to generate electron density maps using ccp4_v4.0.1. The
programs used all report normal termination.
I can display these maps correctly when using the O fast map commands however
when I use fm_rsr_group I get a segmentation error resulting in a core dump.
I run these maps through es_mappage to generate an O style map, however when
I display these using the map_file command etc the maps are displaced away
from the model. I've also had problems generating xtalview maps.
First of all I attach a gif image of the probelem I had. My solution was to use SFTOOLS to import the ccp4 map and then ouput the map in ...dn6 format. This has worked.
Other suggestions included checking the indexing of the data, confirming that the unit cell paramateres are indentical in the pdb and mtz, using FFT.big to generate the maps, and using mapmask to put the map around the the molecule.
(September 2000)
I'm trying to calculate rmsd's for loops of interest in different proteins and have tried a few different methods. I found that...
So, I did what I think has tricked TOPP into doing what I want.... almost....
I made an artificial set of HELIX cards listing all my loop residues as helices. This way, I bypass TOPP's eveluation of secondary structure and it just does the rmsd's on what I've already 'evaluated' as helices. Problem is when a loop contains only 2 residues or when the rms is larger than 2.0. In those cases, the rms is not calculated for that section and I get errors that look like this....
helix: 11 have rms 4.117280 rejected
helix 12 not more than 2 atoms, rejected
helix 13 rms is 2.6 more than 2.0 rejected
I've tried changing these:
RESIDUE 1
DISTANCE 10.0
But it doesn't change the errors at all.
Summary of the suggestions with my comments from trying them...
    Argh!  I have 9 complexes of dimers with a TIM barrel
           and 8 loops of interest in each active site!
           That's 144 edited .pdb files pairwise to DALI.  ;-)
    Also: if I send edited loops to DALI, the overall superposition
           of the protein is not possible and rmsd's are isolated
numbers with little meaning. This is a nice program, but with 144 loops to compare, an
interactive program can't be left to run overnight. These seem convenient, but I didn't
try them, because I found another one I liked before I got
to this suggestion.... sorry!I tried to find these to download from the web, but the names are not unique enough ...too many hits... so I gave up after half hour or so.
                  This one I liked the best!!!
   -It's very flexible!
   -It's script-run... so I wrote the script once and just
    changed the filenames to compare different protein pairs.
   -You can specify exactly which residues to use for the
    LSq-superposition, and exactly which ones to calculate
    the rmsd, and they can be different.
   -You can specify 'C-alpha' or 'all atom' rmsd, so in the CA
    mode, it overlooks mutations (not like CNS).
Note from the ProFit author: There is no official publication on ProFit, apart from the above URL. There will be a new version of ProFit (v2.0) in the very near future.
(September 2000)
Can someone give me some hints on how to calculate the interaction surface area between two protein molecules?
Use CCP4 program AREAIMOL to calculate the accessible surface area for each of the individual proteins and then calculate the surface of the complex. The buried surface area is S(1) + S(2) - S(1-2) and the interaction surface area is half of this value.
Create the surface for each monomer in GRASP (it gives you the area for
the monomer in the little textbox) and then create the surface over the
dimer (which gives you the area for the dimer)
The difference is the area (A) covered: A(interact per molecule) =
(A(monomer)+A(monomer)-A(dimer))/2 gives you the area of interaction per
monomer (or molecule).
The way you do your calculation is correct. You do not specify if you
calculated the accessible surface area or the molecular surface area,
which are two different things. Although the results for most cases are
very similar. To divide by two or not, is your choice. Just make clear
which way you do it. See Jones and Thornton (1996) PNAS 93:13--20,
Lo Conte et al. (1999) J. Mol. Biol 285:2177--2198 and Stanfield and
Wilson (1995) Curr. Opinion Struct. Biol 5:103--113, for a few different
ways of analysing protein-protein interfaces. Jones and Thornton use the
half-values, Lo Conte et al. the total area and Stanfield and
Wilson calculate molecular surfaces instead of solvent accessible
surfaces.
You can also calculate the interface area directly in GRASP by following
menus Calculate - Area of a Surface/Molecule - Molecule - Excluded area.
The program will then list the area of the subunits in complex and free
and the difference of the two. You can then use this information to
project the data to the surface of a molecule. See manual for more info.
Try the protein-protein interaction server at UCL:
http://www.biochem.ucl.ac.uk/bsm/PP/server/
You can use the CCP4 module AREAIMOL in DIFFMODE COMPARE. Create two individual XYZIN (pdb) files, one with all components and a second with one or more of the components removed. Output files will be generated showing regions with altered surface accessibility for the common coordinates. An aside -- this program was useful to us because it can also give quantitative information about crystal packing interactions. See the documentation for all details: $CHTML/areaimol.html. Also, look at Newsletter 38 - article on surface areas.
(January 2001)
I wanted to exclude a few reflections from my data-file using the REJECT flag in SCALEPACK2MTZ. However, the reflections are kept in the output file. What can I do?
Here a summary of useful hints to the REJECT problem in SCALEPACK2MTZ.
   SELECT index h = 1
   SELECT index k = 10
   SELECT index l = 10
   SELECT INVERT
   PURGE
   YES
Using the following awk-script then gives the expected result which can easily be included into an input command file for SFTOOLS:
 awk '$7=="30.0000" {printf"SELECT index h = %3s\nSELECT index k =
%3s\nSELECT index l= %3s\nSELECT INVERT\nPURGE\nYES\n",$1,$2,$3}' fft.log
(February 2000)
I was having a quick look round RCSB and PDBSum to find a site where I can run a primary structure through a blast/fasta/etc to find sequence homologs of known structure. The old Brookhaven site had one - I am sure there's one still out there somewhere. Could someone please send me the URL.
ProDom - something similar but a little less direct
PROtein Sequence Analysis Launcher, where you can get through to most of the following:
EBI, then "other search services" and "list of PDB structures in FASTA format".
(February 2000)
I am looking for a program to compare active sites of enzymes that bind the same ligand but do not have the same fold. The program should propose alignments of the two substructures with amino acids of similar chemical properties in equivalent positions.
Try
(May 2000)
Is there any example in which a protein binds Zn++
via methionine SD?
or, Is there any way to search the PDB with unix commands like
grep LINK *.pdb |grep MET |grep ZN
if you don't have a local copy of the PDB?
I've tried searching the HAD at http://www.bmm.icnet.uk/had/,
but it doesn't seem to be fully functional yet.
Here are some URLs:
Of these the Jena database was the easiest to use, just enter Zn and Met in the residues textbox and submit. It found no example, but many hits with Cu + Met or Zn + Cys, verifying the search procedure.
The Scripps database found 1 trivial example in which the Zn is bound to mainchain atoms of Met: 1b0n.
Miriam Hirshberg wrote a script to search their local PDB for occurrence of ZN and MET together in LINK records. There were no hits found (1b0n has no LINK records!).
Herbert Nar referred me to Azurin structures in which the metal has been switched. Native has Cu, with a 3.0Å bond to MET SD. When replaced with Zn, Met 121 is no longer coordinated to the Zn (this from abstract of Nar et al. 1992, Eur. J. Biochem. 205, 1123).
So it looks as if Met doesn't bind Zn, which seems reasonable enough. Zn is in the same column of the periodic chart as Hg, which Petsko says doesn't react with methionines. All the zincs I've seen so far bind to cys or his (or in 1b0n to the mainchain N and O of a methionine).
I have this strong anomalous peak at the Zn edge in a sample soaked with ZnCl2, and it's next to a highly conserved MET (so I don't think it's a sequencing error). The distance is a little too long for a S-Zn bond (around 2.0Å in SOD) though, so maybe there's another atom between.
A lot is written on the bulletin board about the compilation of CCP4 on the various available platforms. Because there are so many details and intricacies, it would be best to check the CCP4 Problems Pages and the bulletin board archives for this (see the CCP4BB web pages on how to do this).