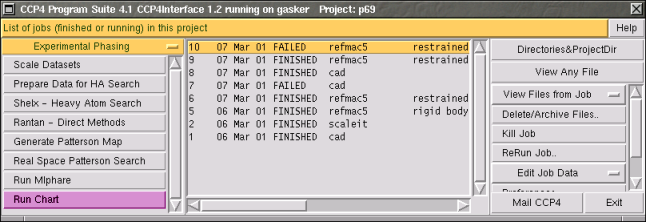
Figure 1. The position of Chart in the scheme of things.
Chart is a program that uses SHELXS and the CCP4 Program Suite to solve structure with minimum effort. It has recently been given a CCP4i interface. The traditional Chart interface is still part of the Chart distribution, but this new GUI interfaces (more) smoothly with CCP4i.
Chart is part of "Experimental Phasing" and can be found under "Run Mlphare" (Figure 1).
Figure 1. The position of Chart in the scheme of things.
Chart is suitable for MIR(AS), SIR(AS), MAD and SAD structure determination. Shown in Figure 2, is an example usage for MIRAS.
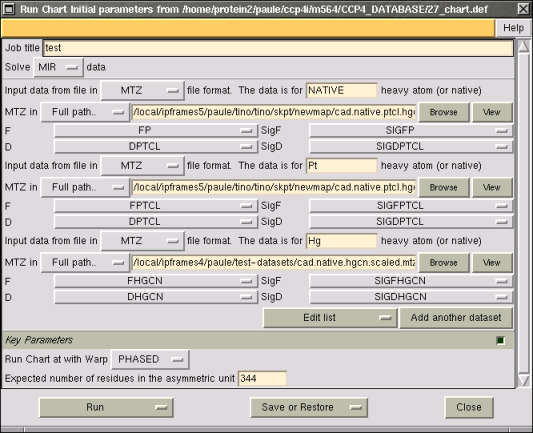
Figure 2: Typical MIR Chart usage.
The starting point for Chart is the data file created by TRUNCATE (truncated.mtz or some such), or you can use post-scalepack merged .sca files. (It is conceivable that Chart can be plugged into the back end of Auto-mosflm - but that is for the future).
Chart proceeds through the steps of structure determiation: scaling, heavy atom site determination, additional difference map sites, MLPhare phasing, hand inversion and density modification. Chart compares the output of both hands and decides if the structure has been solved and then creates plotted maps for both hands so that you can inspect them visually. Additional, during MAD structure determination, Chart will provide maps of the various heavy atom site sets.
Chart can then (optionally) proceed with ARP/wARP (although the parameter choice is limited compared to running ARP/wARP by other methods), this produces a PDB coordinate file.
This interface is new and under development (and it not available in the current stable release). However, we can see no reason why it will not be available in the next CCP4i release (and/or the next Chart release).
To learn more about Chart, visit the Chart webpage.
08-Mar-2001