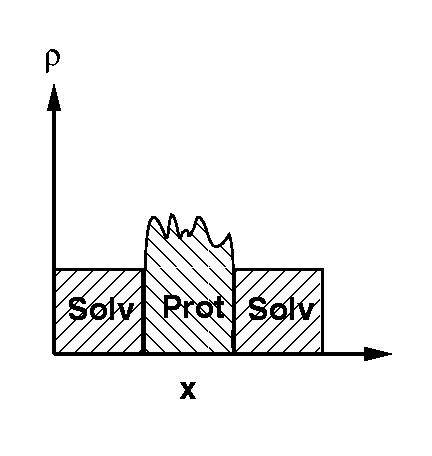
Protein crystals contain between ~30% and ~70% solvent [1], most of which is disordered in the solvent channels between the protein molecules of the crystal lattice (this disordered solvent will here be denoted as bulk solvent). Thus, the electron densities of the protein molecules, with typical values of 0.43 e/A^3, are surrounded by a continuous bulk solvent electron density ranging from 0.33 e/A^3 for pure water to 0.41 e/A^3 for 4M ammonium sulphate (Figure 1).

Figure 1 Schematic picture of the protein electron density in a crystal ("Prot"), surrounded by a continuous bulk solvent electron density ("Solv").
If no model for this continuous bulk solvent electron density is taken into consideration, atomic protein models are artificially placed in a "vacuum" environment, leading to a vast overestimation of the electron density contrast at the protein surface. This in turn leads to calculated structure factor amplitudes which are systematically much larger than the observed structure factor amplitudes at resolutions below ~5A (Figure 2; all example calculations were made with the structure and data of EcoRV complexed with cognate DNA which was crystallised from a low salt buffer, PDB entry code 1rva [2]; all scale factors were calculated for the resolution range 5.0-2.0A and applied to the whole resolution range 20.0-2.0A; all analyses were made in 100 equal volume shells with ~333 reflections per shell).
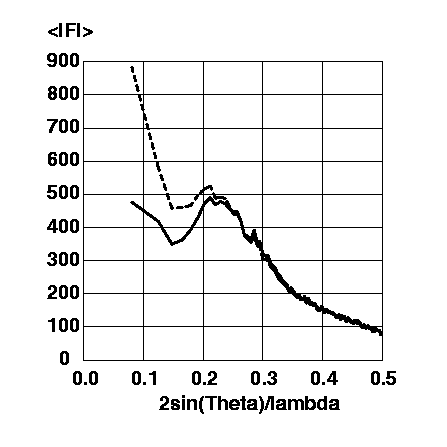
Figure 2 Magnitude of observed structure factor amplitudes (solid line) and calculated structure factor amplitudes without a bulk solvent correction (dashed line) on an arbitrary scale against resolution.
This systematic deviation between observed and calculated structure factor amplitudes leads to severe problems in scaling, in least-squares refinement with its assumption of Gaussian error distributions, and in electron density difference map calculations. In the past, it was common practice to cirumvent these problems by cutting the data at a lower resolution of, say, 6A. However, doing so creates distortions of the local electron density contrast in the protein region (for an optical example, see Kevin Cowtan's duck [3]). A better solution is to include an appropriate model for the bulk solvent, thus allowing the use of all data during scaling, refinement, and electron density difference map calculations. The currently available bulk solvent models will be discussed.
Some definitions: FProt, calculated structure factor of the atomic protein model; FSolv, calculated structure factor of the bulk solvent model; FTotal, calculated structure factor of the atomic protein model including a bulk solvent model.
A simple bulk solvent model is the downscaling of the calculated structure factor amplitudes at low resolution to yield the total structure factor amplitude according to formula (1) [4]
![]() (1)
(1)
This formula is an application of Babinet's principle, (i.e. the structure
factors of a mask have the same amplitudes but opposite phases as the structure
factors of the complementary mask). In other words, it is assumed that the
structure factors of the bulk solvent electron density are directly proportional
to the structure factors of the protein electron density with strictly opposite
phases. However, this approximation is only true at resolutions lower than
~15A, using observed protein phases to estimate phase differences [5].
Typical values for the two scaling parameters are ksol=0.75-0.95, where
ksol reflects the ratio of the solvent electron density to the protein electron
density (see Introduction), and Bsol=150A^2-250A^2, which restricts the
downscaling basically to resolutions below ~ 5A. Because of its simple form,
this exponential scaling bulk solvent model is implemented in most of the
crystallographic refinement programs, namely REFMAC, RESTRAIN, SHELXL-93/97,
TNT and BUSTER (for an overview of macromolecular refinement programs see [6]).
In the mask bulk solvent model, the protein molecules are placed on a grid in the unit cell, and all grid points outside the protein region are filled with bulk solvent electron density. The protein boundary is determined by the sum of the atomic van-der-Waals radii and a solvent probe radius, SOLRAD. This creates a "vacuum" gap of width SOLRAD between the van-der-Waals surface of the protein and the border of the bulk solvent mask. This gap is then filled by extending the bulk solvent mask with a radius, SHRINK. The combination of the two radii SOLRAD and SHRINK produces a bulk solvent mask in close contact to the van-der-Waals surface of the protein, leaving tiny internal holes and channels "empty". The calculated structure factors of the bulk solvent electron density, scaled with a factor ksol and smoothed with a B-factor Bsol, are then vectorally added to the calculated structure factors of the protein to give the total structure factors according to formula (2)
![]() (2)
(2)
This mask bulk solvent model is implemented in X-Plor 3.851 [7]. The two scaling parameters ksol and Bsol are determined in a least squares refinement of the total model structure factor amplitudes against the observed structure factor amplitudes in two resolution ranges. No assumption is made about the phase relationship between the protein structure factors and the bulk solvent structure factors. The recommended values of SOLRAD and SHRINK are 1.0A and 1.1A, respectively [7]. However, one should check the volume of solvent grid points (with MASK=1) given in the output file: best results are obtained, if this volume is ~2-4% smaller than the calculated solvent volume of the crystal [1] (for a complete protein model including ordered solvent molecules). If this is not the case, one can try to set SOLRAD to a value equal to or slightly bigger than the sampling grid size, and SHRINK to a value between SOLRAD and SOLRAD+0.2A. This parameter combination can produce slightly better results than SOLRAD=1.0A and SHRINK=1.1A, but it requires some additional time for testing. (The mask calculation appears to be completely insensitve to SOLRAD/SHRINK values smaller than the sampling grid size. Thus, the recommended parameter set for X-Plor 3.1 with SOLRAD=0.25A, ksol equal to the electron density of the crystallisation buffer and Bsol=50A^2 is not applicable to X-Plor 3.851.) Typical refined values for the two scaling parameters are ksol=0.3-0.4, reflecting the electron density of the crystallisation buffer, and Bsol=15A^2-40A^2, which produces a rather steep fall-off of the bulk solvent electron density with minimum overlap with the protein electron density.
Figure 3 shows a comparison of observed and calculated structure factor amplitudes without a bulk solvent model and with the two available bulk solvent models.
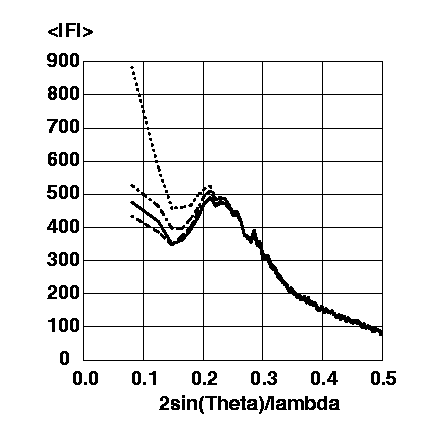
Figure 3 Magnitudes of the observed structure factor amplitudes (solid line), of the calculated structure factor amplitudes from the protein model without a bulk solvent correction (dotted line), of the calculated structure factor amplitudes from the protein model with the exponential scaling bulk solvent correction using ksol=0.74 and Bsol=189.5A^2 (dashed line), of the calculated structure factor amplitudes from the protein model with the mask bulk solvent correction using SOLRAD=1.0A, SHRINK=1.1A, ksol=0.31 and Bsol=35.2A^2 (dashed-dotted line). All amplitudes are put on an arbitrary scale.
The systematic deviation of the calculated protein structure factor amplitudes without a bulk solvent correction from the observed structure factor amplitudes is clearly visible. At the lowest resolution shell (20.0-9.0A) the calculated structure factor amplitudes are twice as large as the observed strcuture factor amplitudes. Much better correspondence between calculated and observed structure factor amplitudes can be achieved by the application of a suitable bulk solvent correction. The exponential scaling model seems to underestimate the contrast between protein and bulk solvent electron density, probably because of its intrinsic assumption of strictly opposite phases. The mask model seems to overestimate the contrast between protein and bulk solvent electron density, probably because all cavities with radii smaller than SOLRAD are left "empty".
A comparison of the bulk solvent structure factor amplitudes is shown in Figure 4.
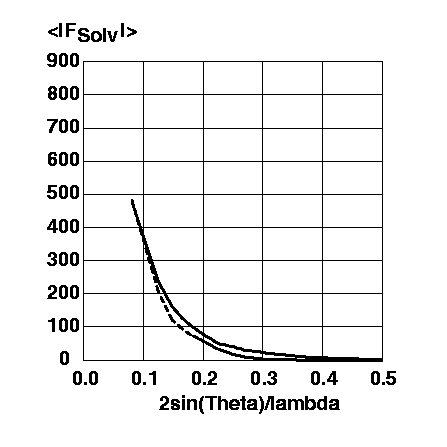
Figure 4 Magnitude of the structure factor amplitudes of the mask bulk solvent model using SOLRAD=1.0A, SHRINK=1.1A, ksol=0.31 and Bsol=35.2A^2 (solid line) and of the exponential scaling bulk solvent model (righthand term of formula (1)) using ksol=0.74 and Bsol=189.5A^2 (dashed line). The structure factor amplitudes are on the same arbitrary scale as in Figure 3.
Both bulk solvent models show structure factor amplitudes at low resolution half as large as the calculated structure factor amplitudes of the protein without a bulk solvent correction. This leads to the desired correction if the phases of the bulk solvent and the protein are opposite. In the exponential scaling bulk solvent model, this phase relationship is an intrinsic assumption. For the mask bulk solvent model the phase relationship is shown in Figure 5.

Figure 5 Phase differences between the calculated structure factors of the atomic protein model and of the mask bulk solvent model.
The phases of the atomic protein model and of the mask bulk solvent model
are approximately opposite at low resolution. This phase relationship is
completely lost at resolutions higher than ~4A. The calculated phase differences
are very similar to the estimation of phase differences using observed protein
phases [5].
The resulting phases of the protein model with the mask bulk solvent correction
differ to the phases of the protein model without a bulk solvent correction
between ~5deg at 4A to ~30deg in the lowest resolution shell, 20.0-9.0A
(data not shown).
The mask bulksolvent model appears to be a more realistic description of
the true bulk solvent electron density than the exponential scaling bulk
solvent model. This is also reflected in the R-factor as shown in Figure
6.
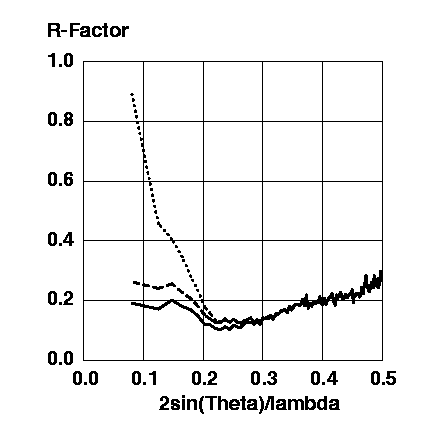
Figure 6 R-factors for the protein model without a bulk solvent correction (dotted line), for the protein model with the exponential scaling bulk solvent correction (dashed line), and for the protein model with the mask bulk solvent correction (solid line).
The mask bulk solvent correction gives a clearly better approximation to the observed structure factor amplitudes than the exponential scaling bulk solvent correction, producing R-factors which are ~5-7% lower in the low resolution range.
To give a realistic picture of the effect of the bulk solvent correction on electron density difference maps a simulated-annealing omit refinement [8] was done for the following amino acids (average B-factors in brackets): Tyr138 (23.5A^2), Thr139 (27.8A^2), Arg140 (44.6A^2), Val141 (39.8A^2), Ala142 (53.5A^2), and Thr143 (64.0A^2). Sigma-a weighted [9] omit maps with Fourier coefficients mFo-DFc were calculated without a bulk solvent correction using either data etween 6.0-2.0A or all data, with the exponential scaling bulk solvent correction using all data, and with the mask bulk solvent correction using all data. For comparison, a sigma-a weighted map with Fourier coefficients 2mFo-DFc was calculated for the same (non-omitted) amino acids of the refined structure using the mask bulk solvent correction and all data. The results are shown in Figures 7a-e. Caution: Omitted parts of the structure must be excluded from the XREFIN term prior to the bulk solvent mask calculation. If this is not done, a hole with the shape of the omitted parts will be cut in the bulk solvent mask, appearing as an artificial positive electron density difference map!
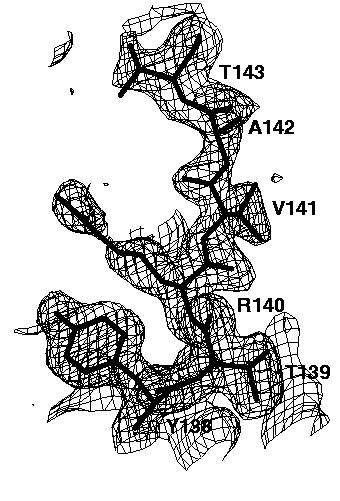
Figure 7a 2mFo-DFc electron density map of the refined structure, contoured at 0.3e/A^3. The amino acids 138-143 were not omitted. The mask bulk solvent correction was applied using all data.
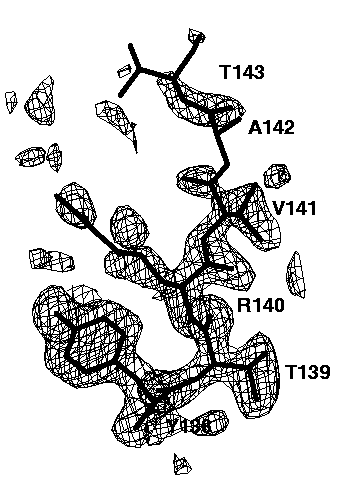
Figure 7b mFo-DFc electron density simulated-annealing omit map using data between 6.0-2.0A, contoured at 0.15e/A^3. No bulk solvent correction was applied.
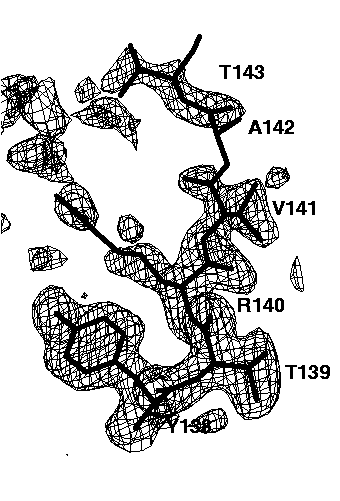
Figure 7c mFo-DFc electron density simulated-annealing omit map using all data, contoured at 0.15e/A^3. No bulk solvent correction was applied.
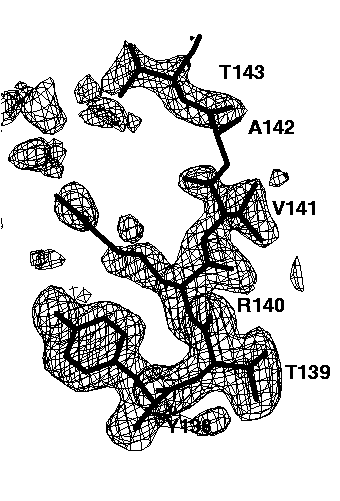
Figure 7d mFo-DFc electron density simulated-annealing omit map using all data, contoured at 0.15e/A^3. The exponential scaling bulk solvent correction was applied.
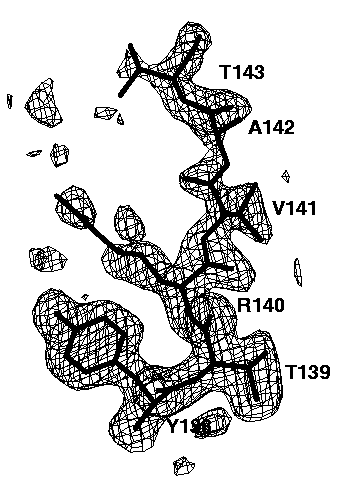
Figure 7e mFo-DFc electron density simulated-annealing omit map using all data, contoured at 0.15e/A^3. The mask bulk solvent correction was applied.
The relatively well ordered amino acids Tyr138, Thr139, Arg140 and Val141 are clearly visible in all omit maps. However, the omit maps of the poorly ordered amino acids Ala142 and Thr143 show different interpretabilities. The worst omit map is the one without a bulk solvent correction cutting all data below 6A (Figure 7b). Here, only a long peak for the main chain peptide group between Ala142 and Thr 143 is visible. This peak is not very interpretable. Lowering the contour level does not help a lot: it makes more of the missing electron density visible but also more false noise peaks appear. If the low resolution data are included (Figure 7c), the electron density of Thr143 becomes visible, but that of Ala 142 is still missing. In addition, many false peaks (on the left side of Thr143) appear, which spoil to some extend the interpretability. A slightly clearer map is obtained, if the exponential scaling bulk solvent correction is applied (Figure 7d). Still, there are a lot of false peaks visible and almost no electron density for Ala142 is visible. By far the best electron density, both with respect to main chain and side chain electron density and with respect to the absence of false peaks is obtained if the mask bulk solvent correction is applied (Figure 7e). The electron density map is now clearly interpretable and almost undistinguishable to the 2mFo-DFc map of the refined structure (Figure 7a).
The mask bulk solvent correction as implemented in X-Plor is the best of the currently available bulk solvent corrections, allowing the use of all data to the low resolution limit in scaling, refinement, and electron density difference map calculations. The most important benefit is the enhanced signal-to-noise ratio of electron density difference maps for missing parts of the model (for instance, soaked inhibitors, partial SIR/MIR models, partial molecular replacement models). These missing parts fall into regions filled with bulk solvent electron density which should theoretically reduce the local contrast of their electron densities. However, the overall positive effects of the bulk solvent correction on the scaling and thus on the calculation of electron density difference maps appears to be overwhelming. It might even well be, that filling the regions of missing parts with a continous electron density is a better approximation to the the true electron density than leaving a "vacuum", thus producing a better approximation to the true phases.
Is the application of a bulk solvent correction overfitting or "R-factor cosmetic"? For the exponential scaling bulk solvent model the picture is simple: There are only two adjustable parameters in this model compared to between several hundred to a few thousand observed reflections in the low resolution range up to ~5A. The observable-to-parameter ratio excludes the possibility of overfitting in this model. For the mask bulk solvent model, the picture is more complicated: Its boundary is determined by the positons and van-der-Waals radii of the surface protein atoms and the four adjustable parameters SOLRAD, SHRINK, ksol, and Bsol. Although the surface protein atoms are taken as observables it is not clear, how many parameters are really needed to desribe this rather complicated bulk solvent boundary. Practically, the question of overfitting was assessed by the complete Free-R method [7]. There, it was clearly demonstrated that the mask bulk solvent correction is a good description of the low resolution data without any sign of overfitting.
The mask bulk solvent model is already a good model. One possible problem is that the bulk solvent structure factors are calculated from a step function. Fourier transformations of step functions have pronounced high resolution features which lead to aliasing problems if the sampling is too coarse. Given the usual 3x sampling and the relatively low smoothing B-factor, one might expect such aliasing distortions at higher resolution. A finer sampling, say 10x sampling, is prohibitive because of the rapid increase of computation time to calculate the Fourier transformation of the mask. Two solutions to this problem may be possible:
The current mask bulk solvent model assumes a flat uniform electron density distribution in the solvent channels. However, the distribution of water molecules is dependent on the type of surface atoms, leading to a pronounced first shell of higher electron density [7]. With the increasing accuracy of observed phases (cryo-cooling, synchrotron data, MAD phasing, better programs, such as SHARP, SOLOMON) better non-uniform bulk solvent models can be generated. Whether the additional accuracy of these models are worth the computational effort remains to be seen.
[1] Matthews, B.W. (1968). "Solvent Content of Protein Crystals." J. Mol. Biol. 33, 491-497
[2] Kostrewa, D., & Winkler, F.K. (1995). "Mg2+ Binding to the Active Site of EcoRV Endonuclease: A Crystallographic Study of Complexes with Substrate and Product DNA at 2A Resolution." Biochemistry 34, 683-696
[3] Kevin Cowtan's World Wide Web Page: http://www.yorvic.york.ac.uk/~cowtan/fourier/fourier.html
[4] Moews, P.C., & Kretsinger, R.H. (1975). "Refinement of the Structure of Carp Muscle Calcium-binding Parvalbumin by Model Building and Difference Fourier Analysis." J. Mol. Biol. 91, 201-228
[5] Urzhumtsev, A.G., & Podjarny, A.D. (1995). " On the Problem of Solvent Modelling in Macromolecular Crystals using Diffraction Data: 1. The Low Resolution Range." CCP4 Newsletter 31, 12-16
[6] Dodson, E., Moore, M., Ralph, A., & Bailey, S. (Eds.) (1996). "Macromolecular Refinement." Proceedings of the CCP4, DL-CONF-96-001
[7] Jiang, J.-S., & Bruenger, A.T. (1994). "Protein Hydration Observed by X-ray Diffraction." J. Mol. Biol. 243, 100-115
[8] Hodel, A, Kim, S.-H., & Bruenger, A.T. (1992). "Model Bias in Macromolecular Crystal Structures." Acta Cryst. A48, 851-858
[9] Read, J.R. (1986). "Improved Fourier Coefficients for Maps using Phases from Partial Structures with Errors." Acta Cryst. A42, 140-149
[10] Bricogne, G. (1993). "1.3.3.3.2.5. Molecular Envelope Transformation via Green's Theorem.", Int. Tables for Crsytallography, Volume B, 84